Performance Testing using Pingdom
Last Update: October 31, 2025
We all want our websites to load quickly, and there are a number of services out there to help us test, evaluate, and fix various issues affecting the loading speed of our pages. In this series of docs, we will be looking at the major players in this area, Google PageSpeed Insights, GTMetrix, Pingdom and WebPageTest, and how they can help you improve the loading speed of your Avada website. Read on!
Pingdom
Pingdom offers a whole suite of website uptime and performance monitoring tools, but this is a subscription service. However, they also offer the Pingdom Website Speed Test for free. Much like the other testing services, this tool can analyze your website for page loading bottlenecks or other performance issues.

Testing
The Pingdom Website Speed Test is a no frills affair, with the only options being the url to test, and the location from which to test. There are 7 locations from which to choose: Tokyo, Frankfurt, London, Washington D.C., San Francisco, Sydney or São Paulo. Simply select one from the drop down menu to choose where to run the test from. Then click Start Test.

Results Summary
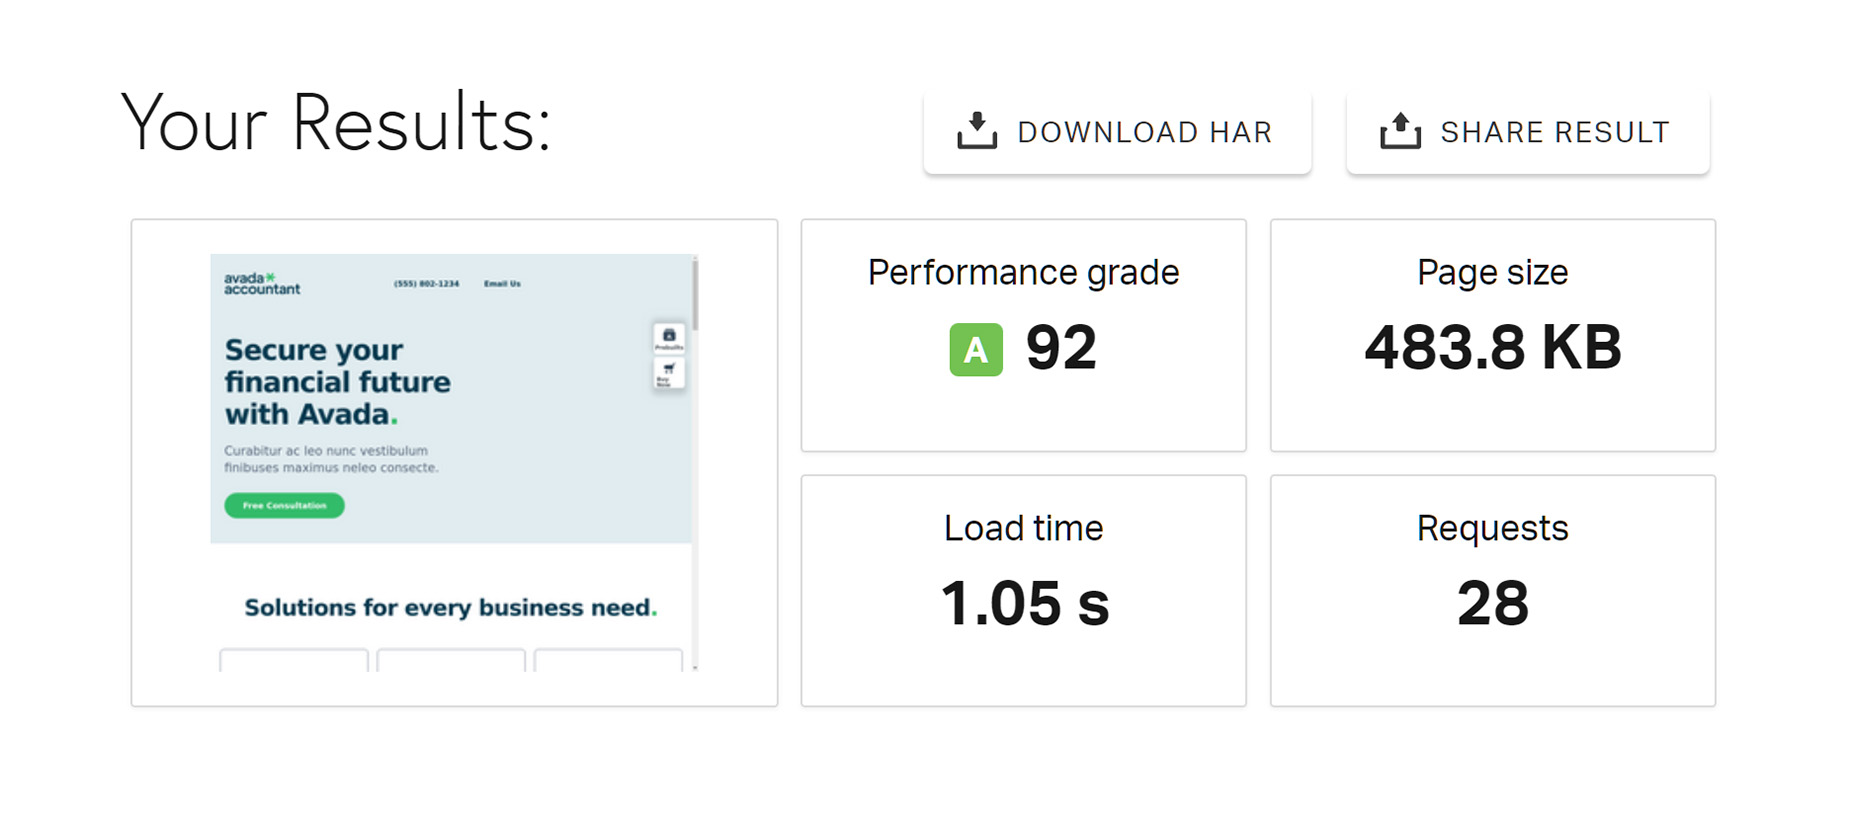
When the test has completed you are presented with a Results Summary. This ranks your website url with a grade (based on the YSlow test), lists the total amount of data transferred, the median load time and the total number of requests made. You can also download a HAR file (The HTTP Archive format, or HAR, is a JSON-formatted archive file format for logging of a web browser’s interaction with a site) or share your results via Social Media.
Of all the tests we cover in this series, Pingdom is by far the simplest in terms of results and information. The free service is bare bones, with no documentation. But it is hugely popular, and this is probably because it is the easiest speed testing tool to use! Not everyone is a web performance expert, and so for the typical WordPress user, some of the other alternative tools out there can be quite overwhelming. Sometimes, less is more. Pingdom focuses on the two most important things: how fast your website is and how you can make it faster.
Improve Page Performance
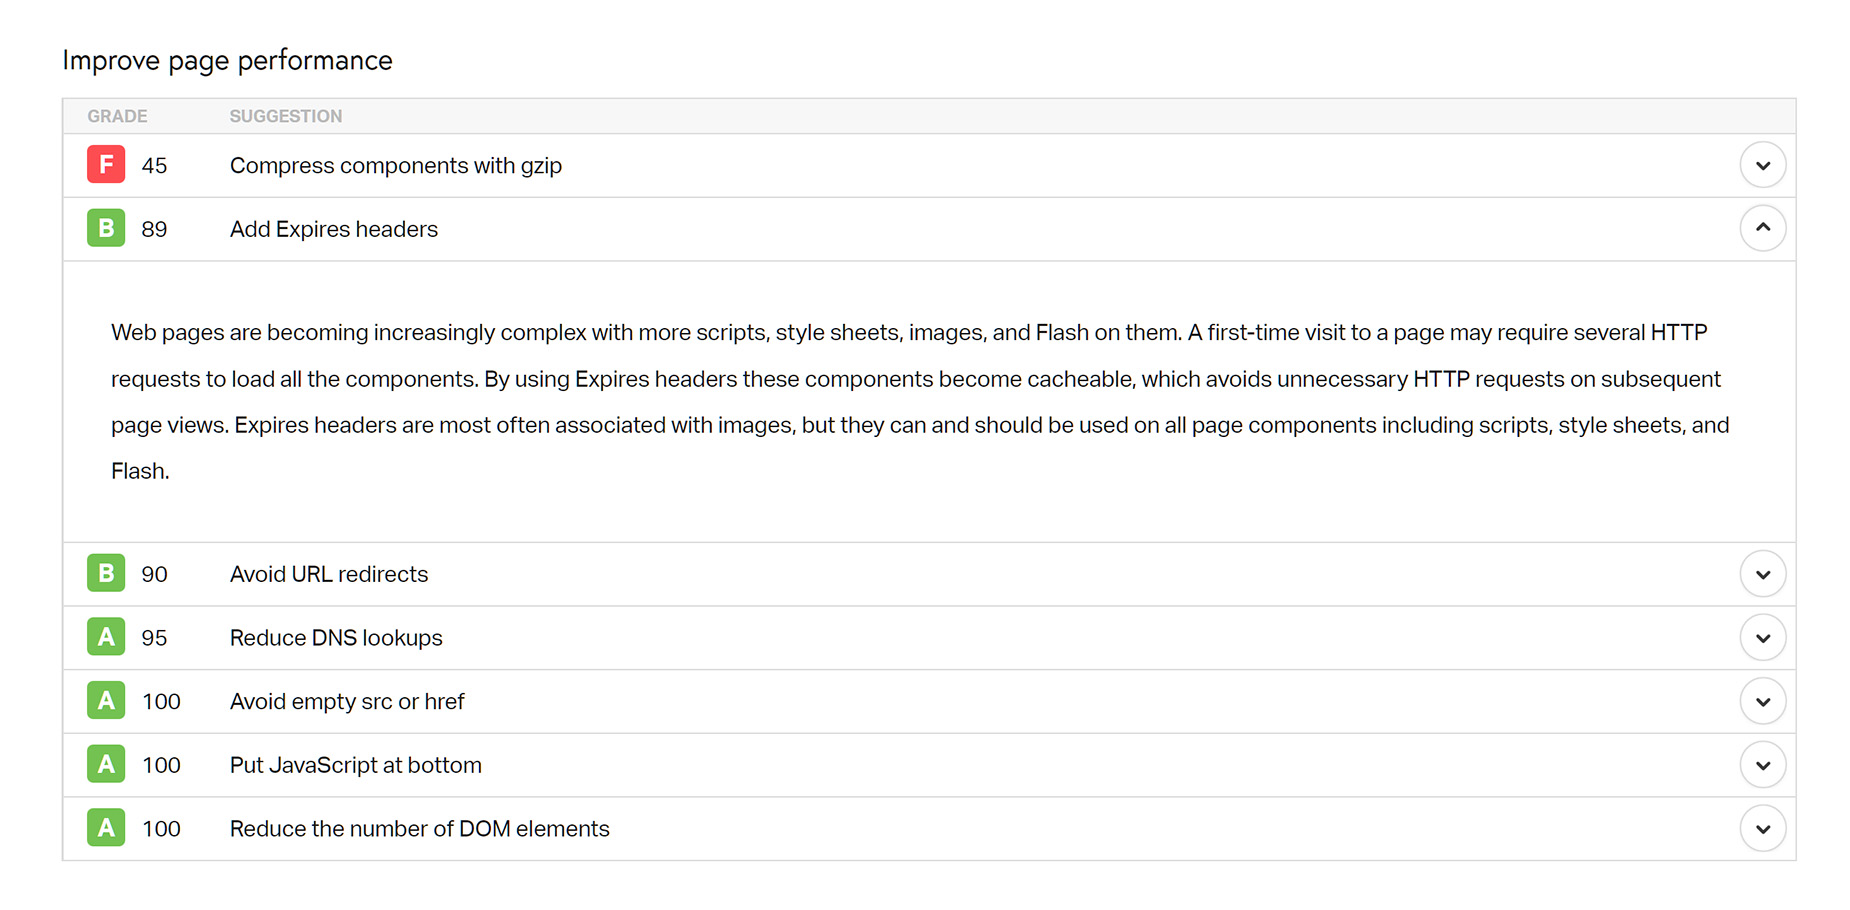
Previously called Performance Insights, and found below the main Results Summary, comes the Improve Page Performance section. This lists individual grades, and a specific score, for the bottom scoring 7 areas that the Pingdom Website Speed Test reports for. Each website may have different suggestions, based on what can be improved.
Next to each suggestion is a drop down arrow which shows further information about that specific issue with suggestions as to how to improve the score.
Response Codes
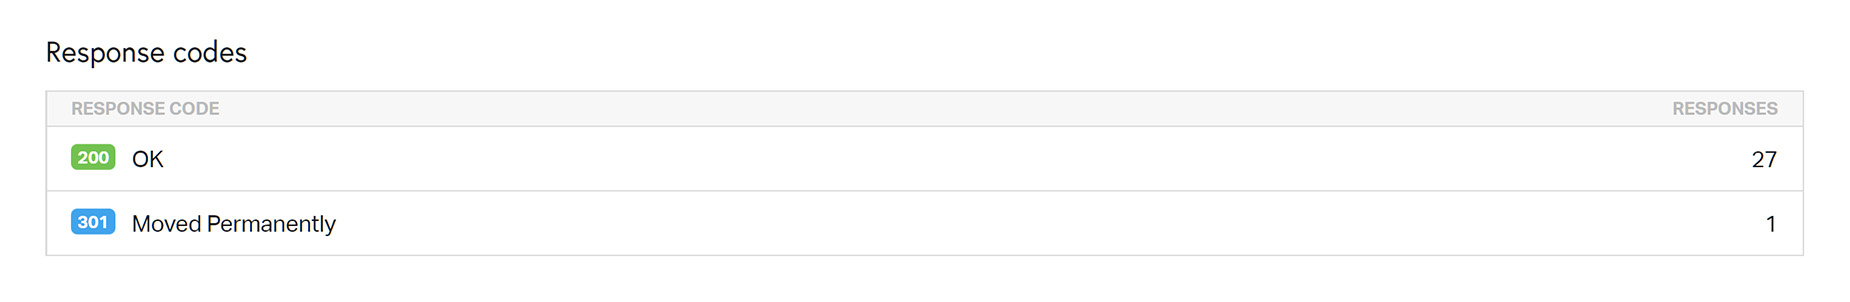
The next section is the Response Codes. This section lists the response codes, also referred to as HTTP status codes, for the page tested. This can show you if the page is OK, (200), has permanent redirects (301) or links to content that can’t be found (404).
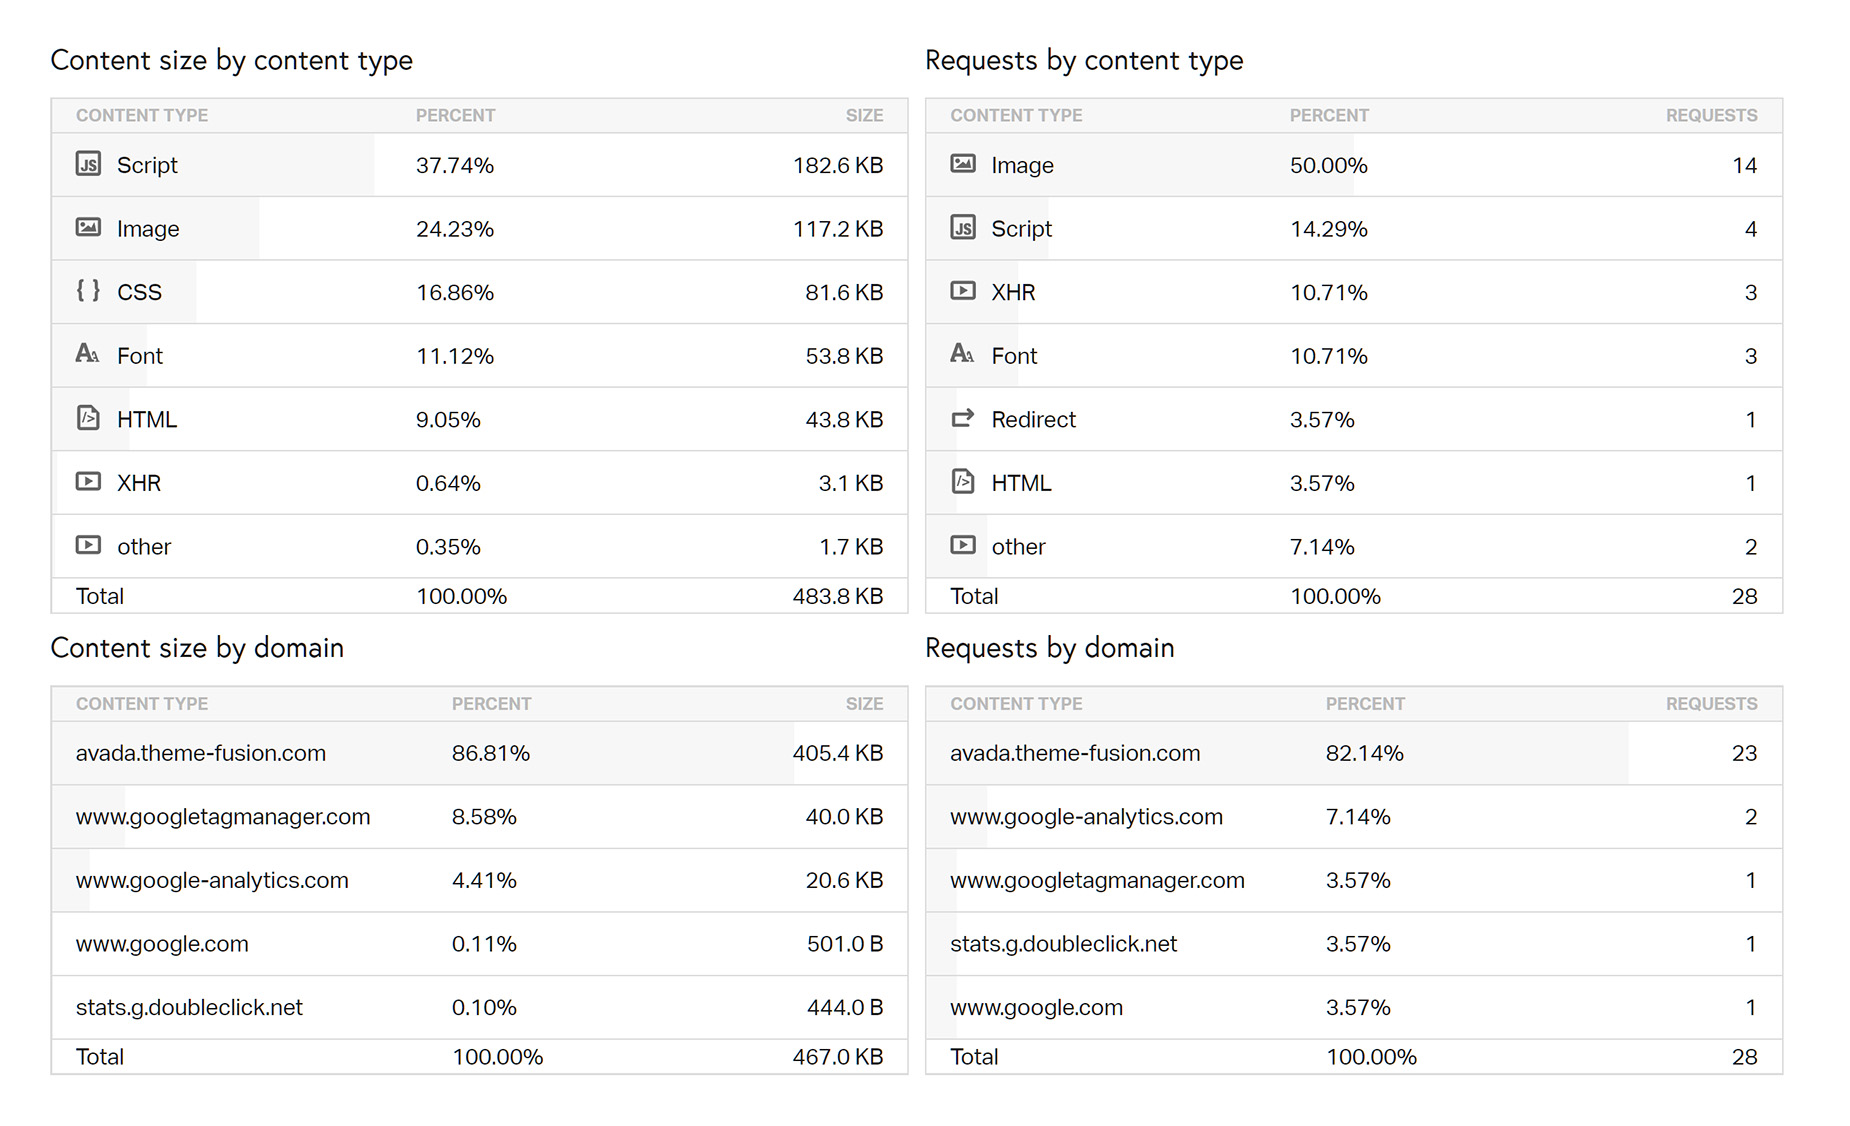
Content Size / Requests by Content Type
The next sections are the Content Size and the Requests by Content Type and Domain. Each of these is useful to quickly see what is taking up the most resources on your web page, both in terms of size and requests.
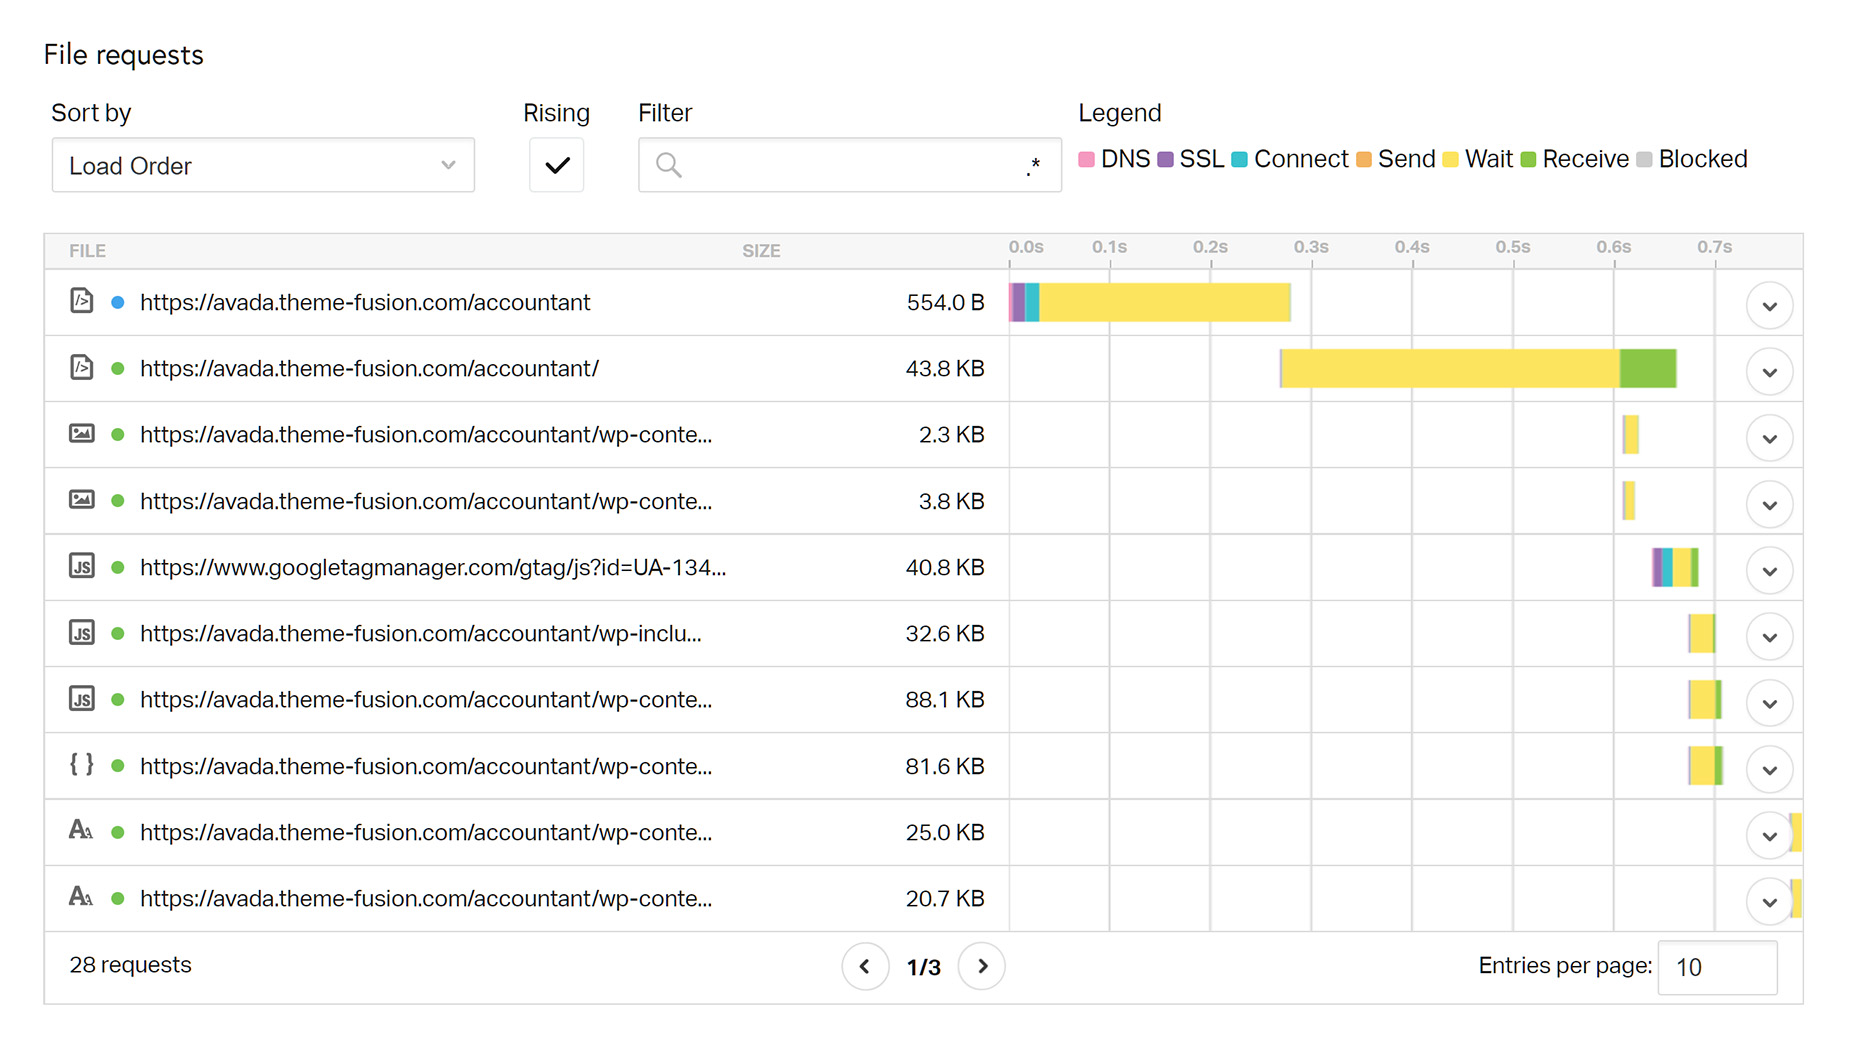
File Requests
This section is a waterfall chart of all the individual requests on your web page. Pingdom’s tests measure TTFB (Time to First Byte). You can sort the waterfall data in many ways, as well as options for changing the order and filtering the information. At the top right, there is Legend, with a color coded system indicating the different stages of a request, and at the left of each request, icons to indicate the different content types of the request. There are also color coded server response codes, showing the various codes. At the bottom of the dialog, you can choose how many entries show per page, which can be useful for sites with a large number of requests.
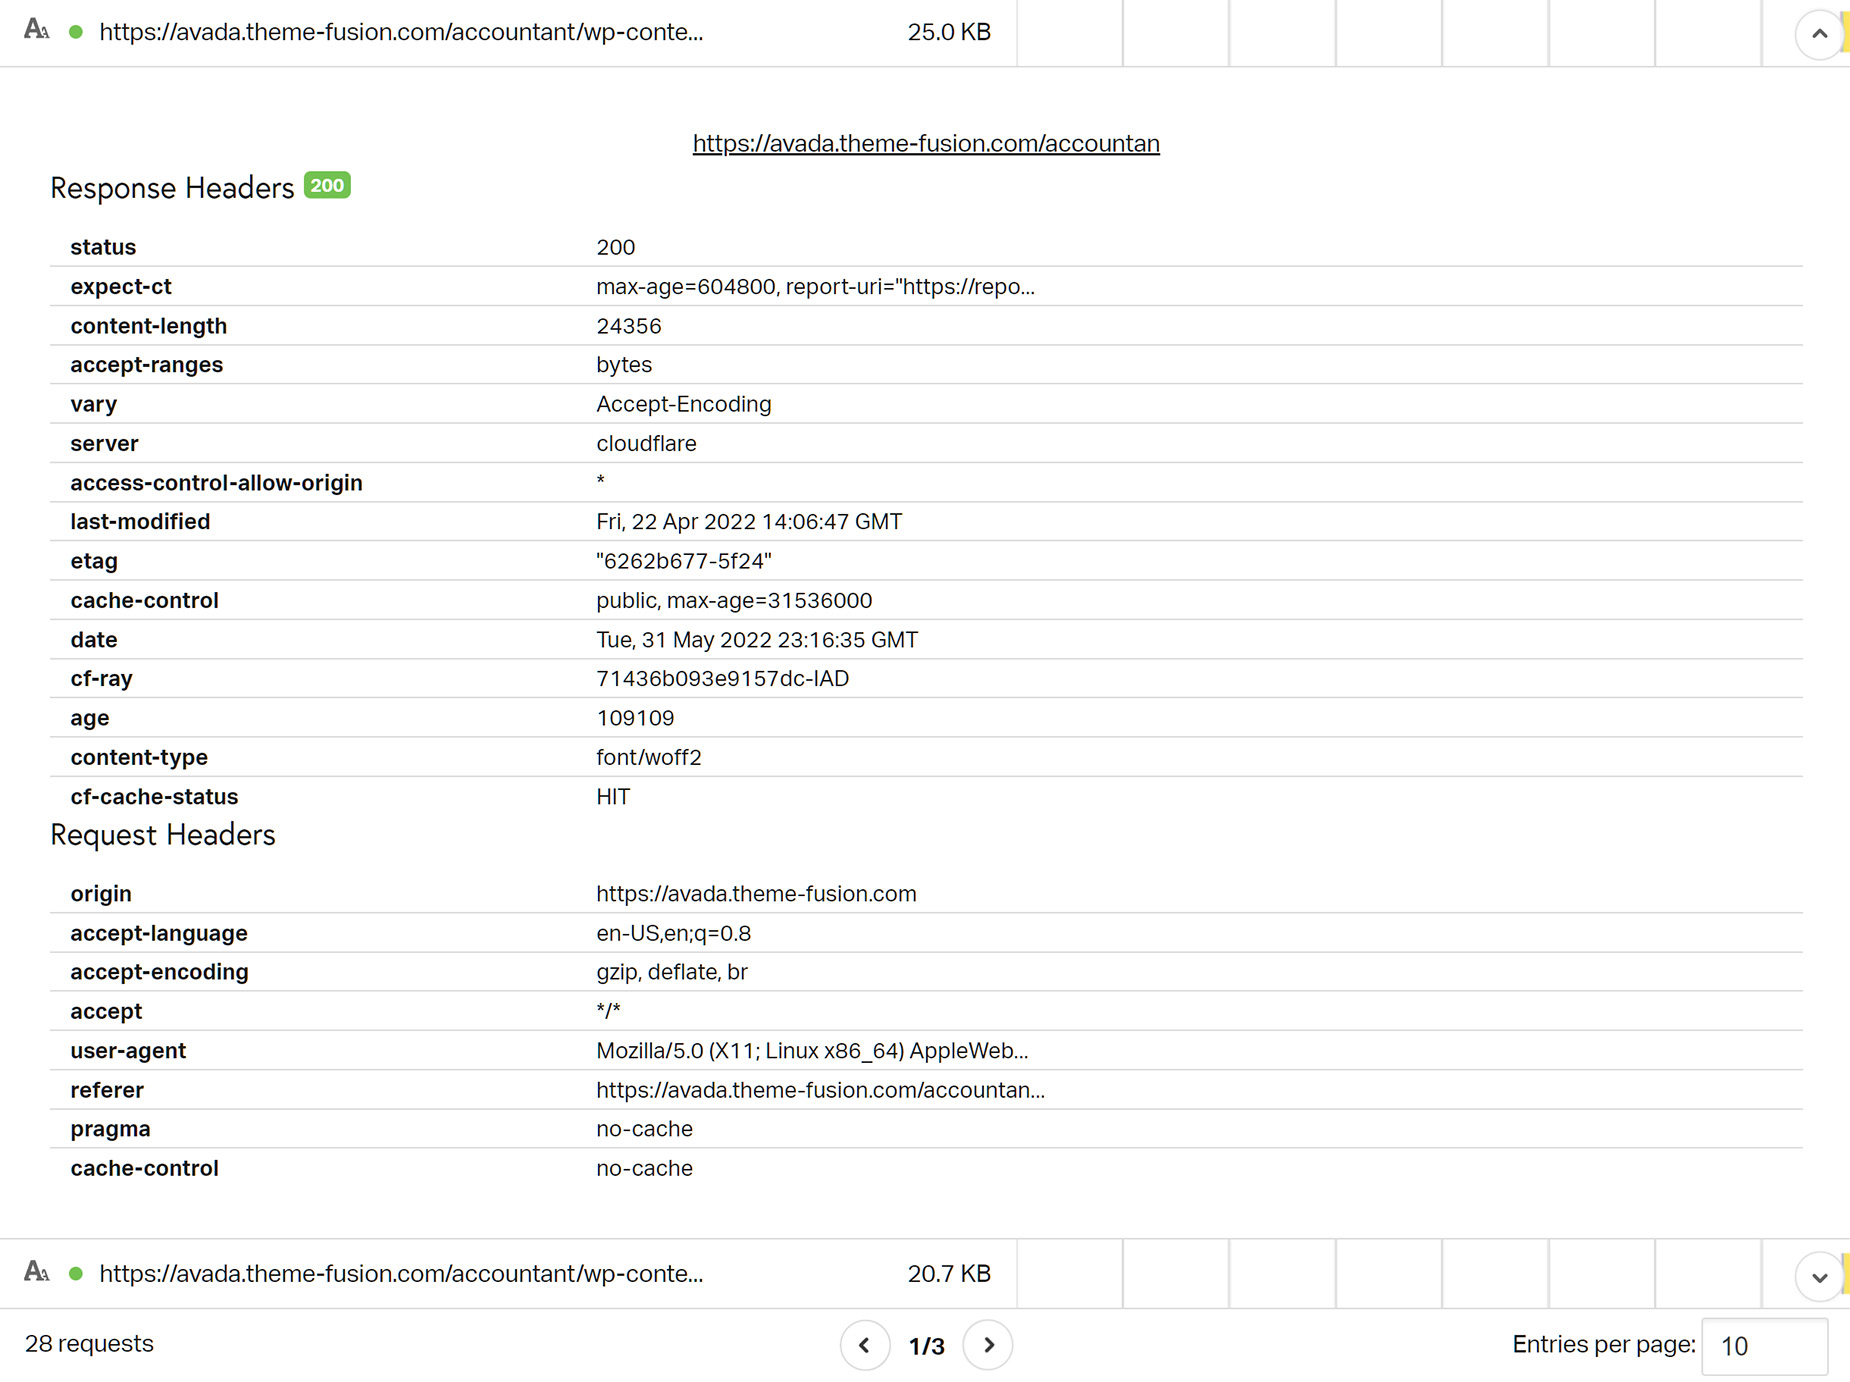
If you want more details, you can drill down into any specific request to see a whole raft of specific details for that individual requested item.
Conclusion
Pingdom Website Speed test is a relatively basic, but very easy to use, tool to help detect and remedy issues that may be affecting your website’s load time. While not providing as much information as the other analysis tools, it’s simplicity and interface might make it more accessible for beginners.
Remember, due to hosting and content variables, website optimization is a very complex, technical area, and falls well outside of the support we can provide for Avada.
Apart from our many documentation resources, the Facebook Avada User’s Group has a large and very active membership, and this topic is regularly discussed on the Group.