Performance Testing using Google PageSpeed Insights
Last Update: April 17, 2024
We all want our websites to load quickly, and there are a number of services out there to help us test, evaluate, and fix various issues affecting the loading speed of our pages. In this series of docs, we will be looking at the major players in this area, Google PageSpeed Insights, GTMetrix, Pingdom and WebPageTest, and how they can help you improve the loading speed of your Avada website. Read on!
PageSpeed Insights
PageSpeed Insights is an online tool from Google, which helps in identifying performance best practices on any given website. The PageSpeed Insights API (PSI) reports on the performance of a page on both mobile and desktop devices, and provides suggestions on how that page may be improved, and suggests overall ideas of how to make a website faster.
To use PageSpeed Insights, simply enter the url of your website, and click Analyze.

Core Web Vitals Assessment
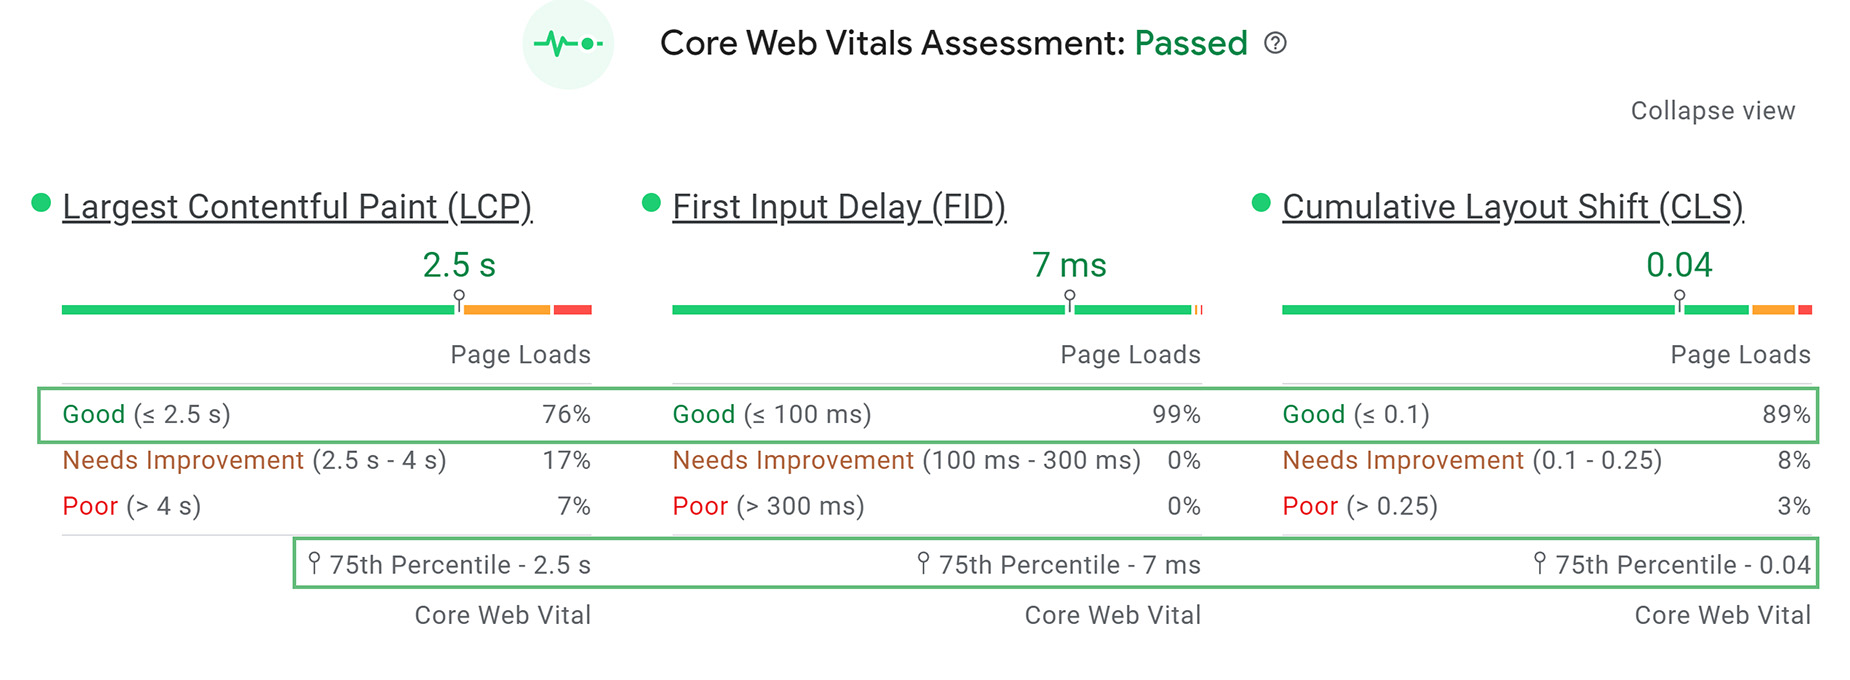
When PageSpeed insights has analyzed your site the results will load on the page. This starts with an assessment of the Core Web Vitals, a collection of metrics that Google consider the most important to real world users. These are the Largest Contentful Paint (LCP), the First input Delay (FID), and the Cumulative Layout Shift (CLS).
Under these other notable metrics are also reported such as First Contentful Paint (FCP), Interaction To Next Paint (INP), and Time To First Byte (TTFB). You can see these results for both Mobile and Desktop. You will notice that the report defaults to the Mobile Results, in line with Google’s Mobile First Indexing. See the Desktop results by clicking on the Desktop link.
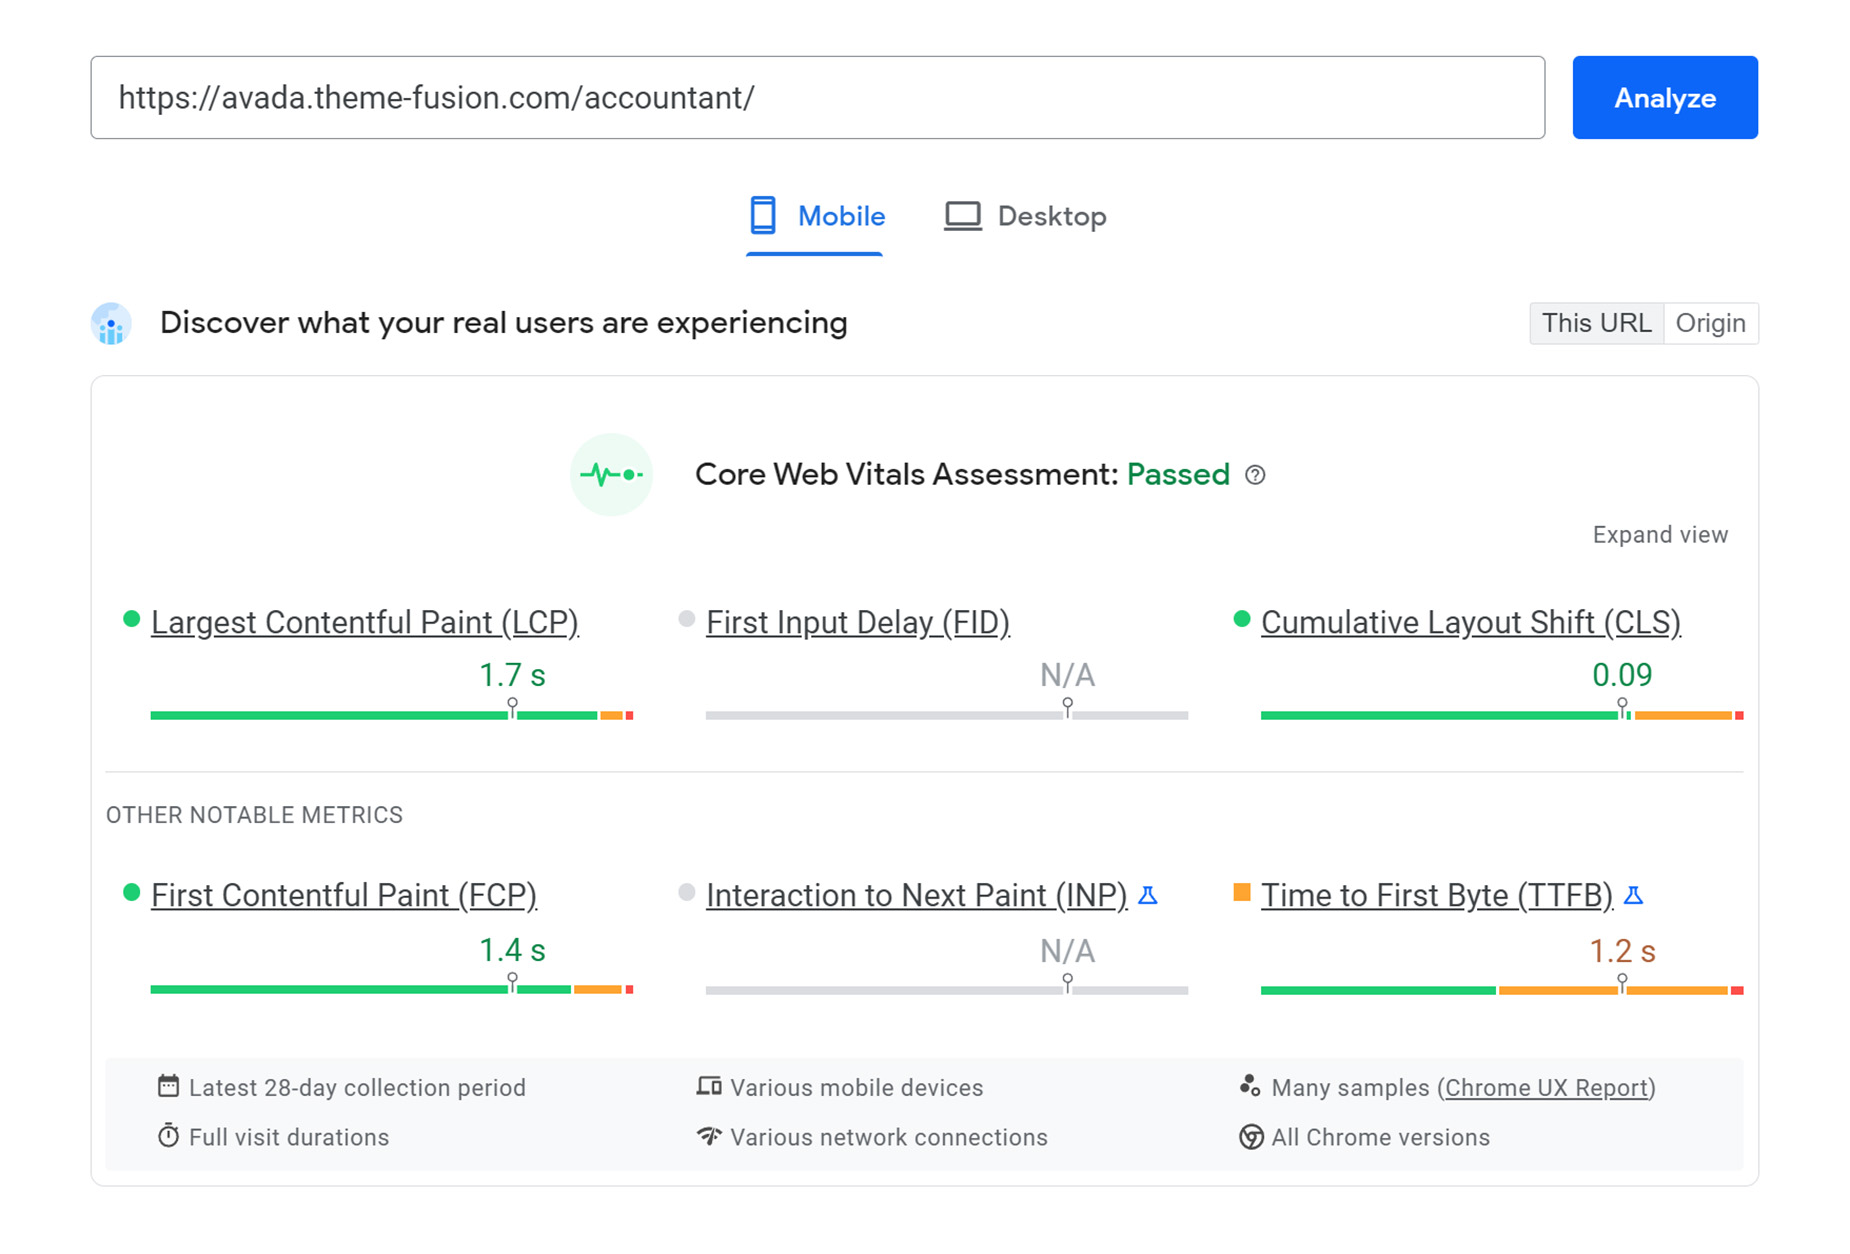
There Is also an Expand View link to get more detail for these metrics. PSI classifies the quality of user experiences into three buckets: Good, Needs Improvement, or Poor. Your users experiences are distributed aloing the line, which is also marked with the 75th percentile for that metric.
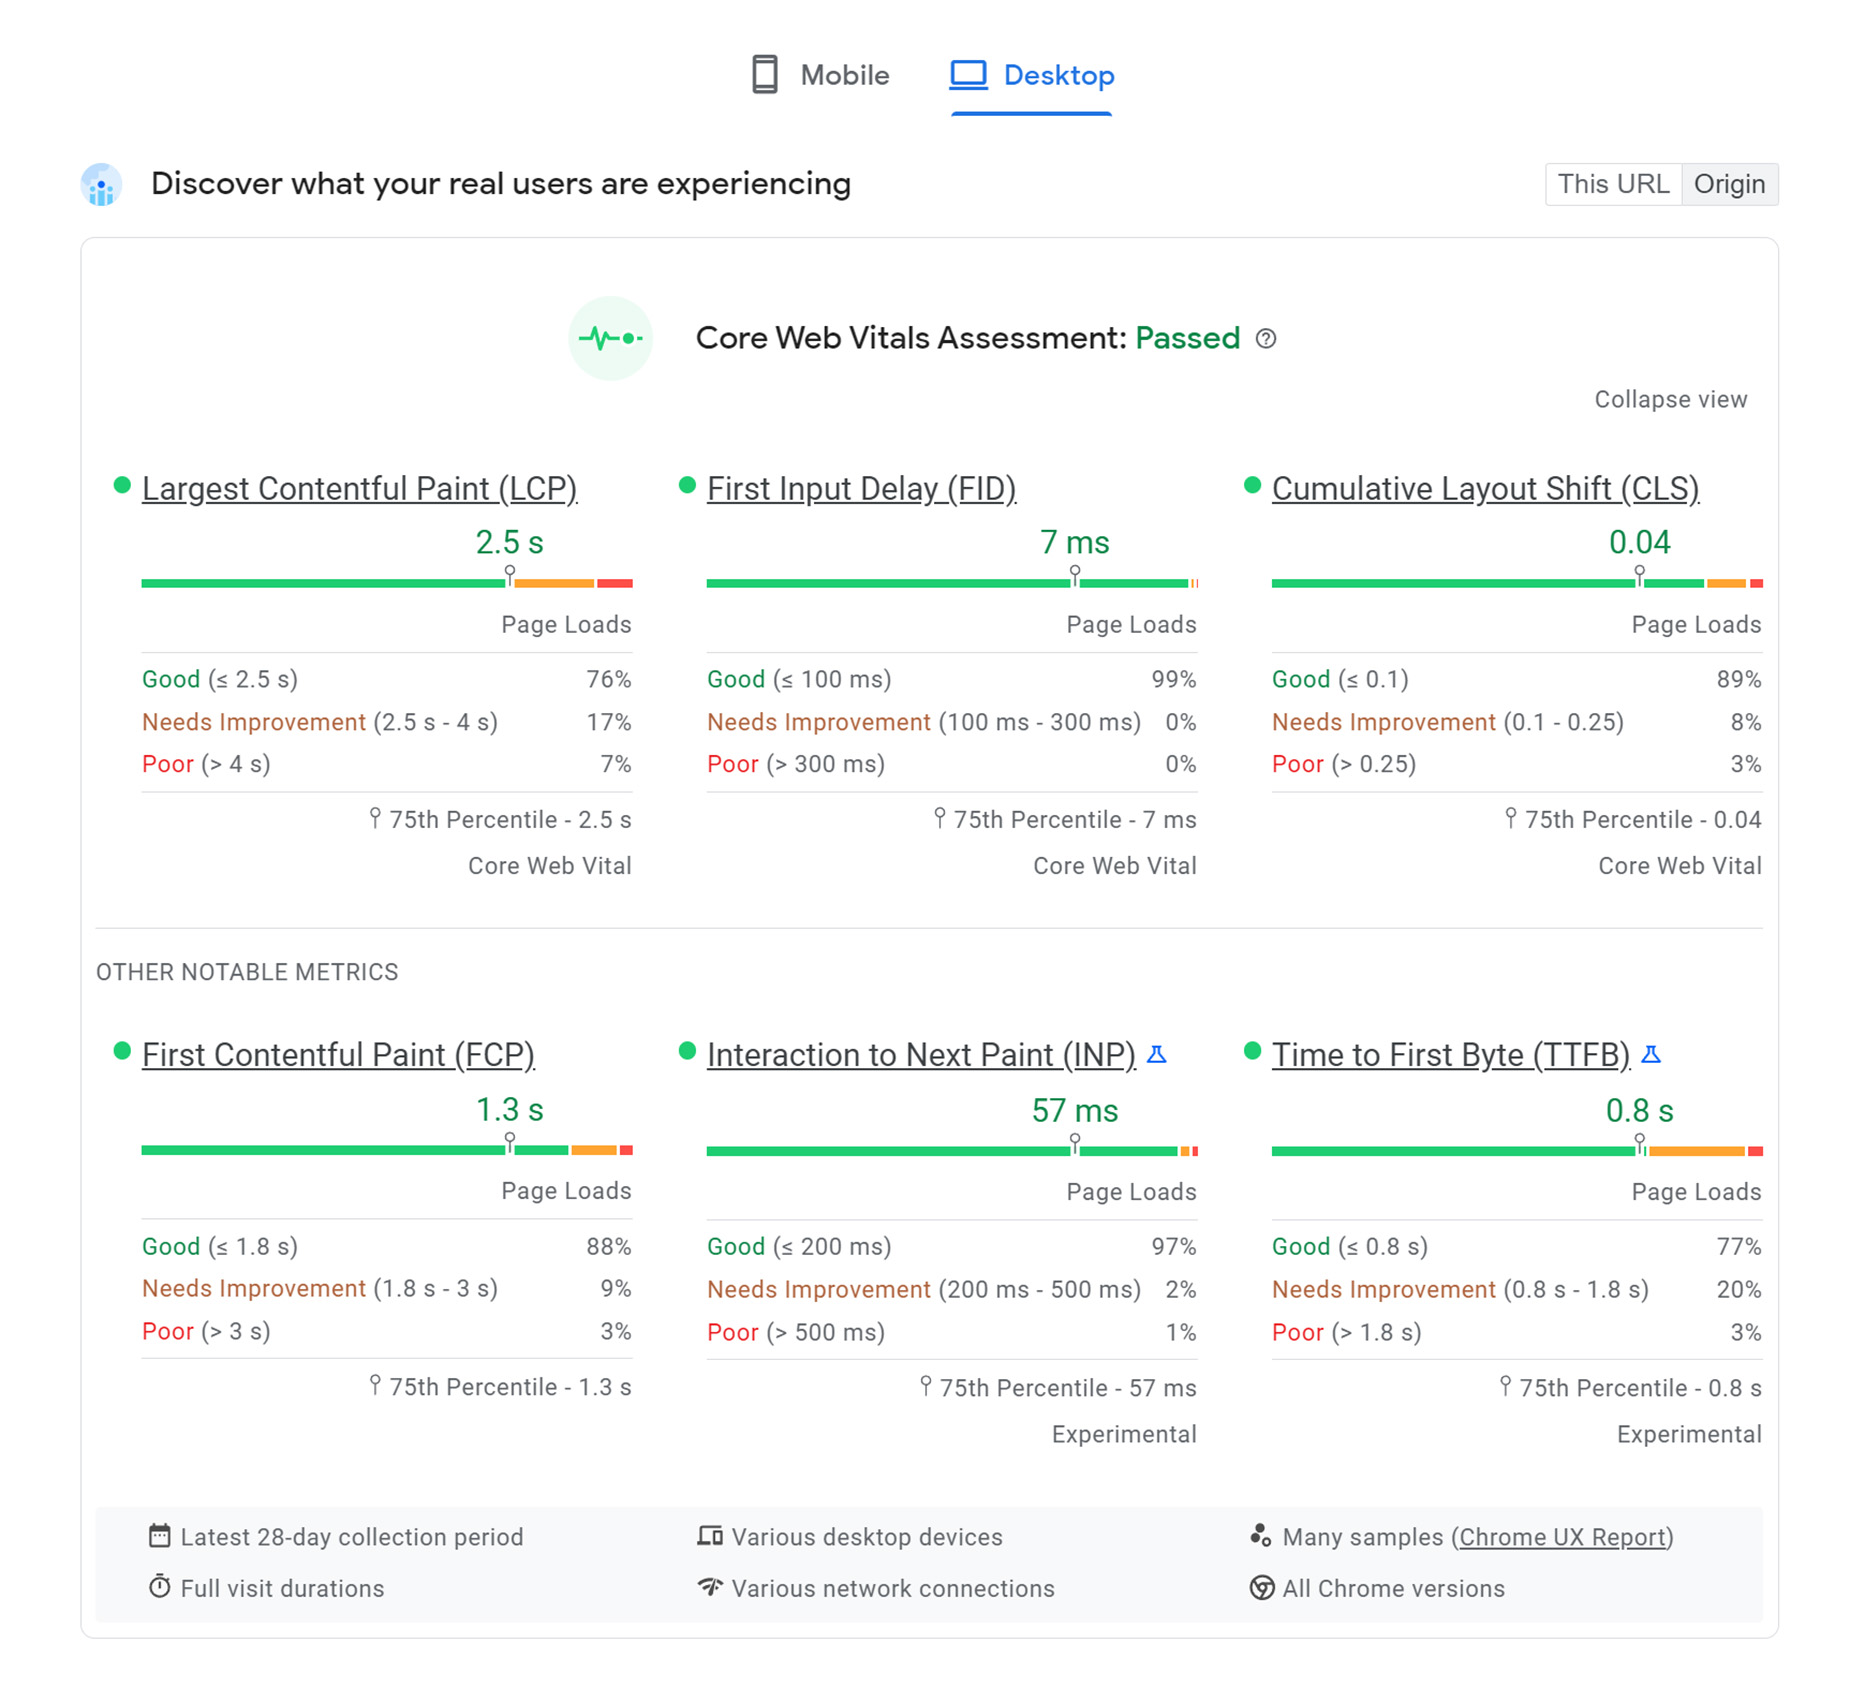
Just to clarify how to read these figures. If we look at the image below, we can see that 76% of page loads got a good result with the Largest Contentful Paint, a full 99% for the First Input Delay, and 89% for the Cumulative Layout Shift. To pass the Core Web Vitals Assessment, you need the percentage of page loads in the Good section to be at or above the 75th percentile.
To read more about how Google defines the Core Web Vital metrics threshholds, see the following page. You can also read more about this in the PageSpeed Insight Docs.
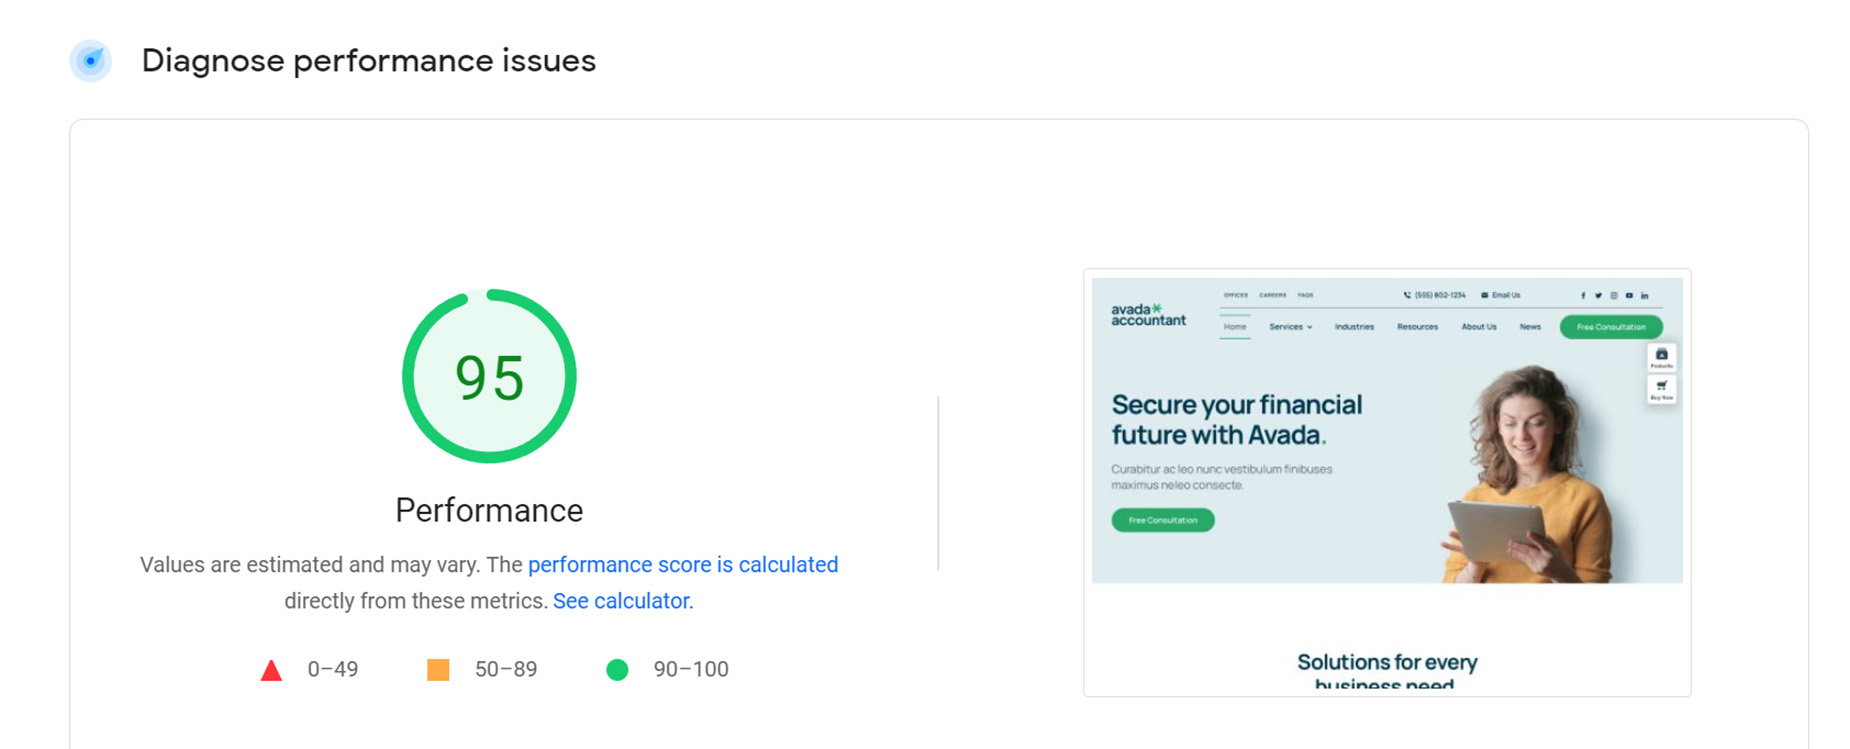
Diagnose Performance Issues
PageSpeed Insights then provides a score which summarizes the page’s performance. This score is determined by running Lighthouselab data about the page. A score of 90 or above is considered fast, and 50 to 89 is considered average. Below 50 is considered to be slow.
Below this Performance Summary are several sections, that first show the data captured, then a range of audits that show how to fix issues, how to generally improve the site, and finally a list of passed audits. Let’s have a closer look.
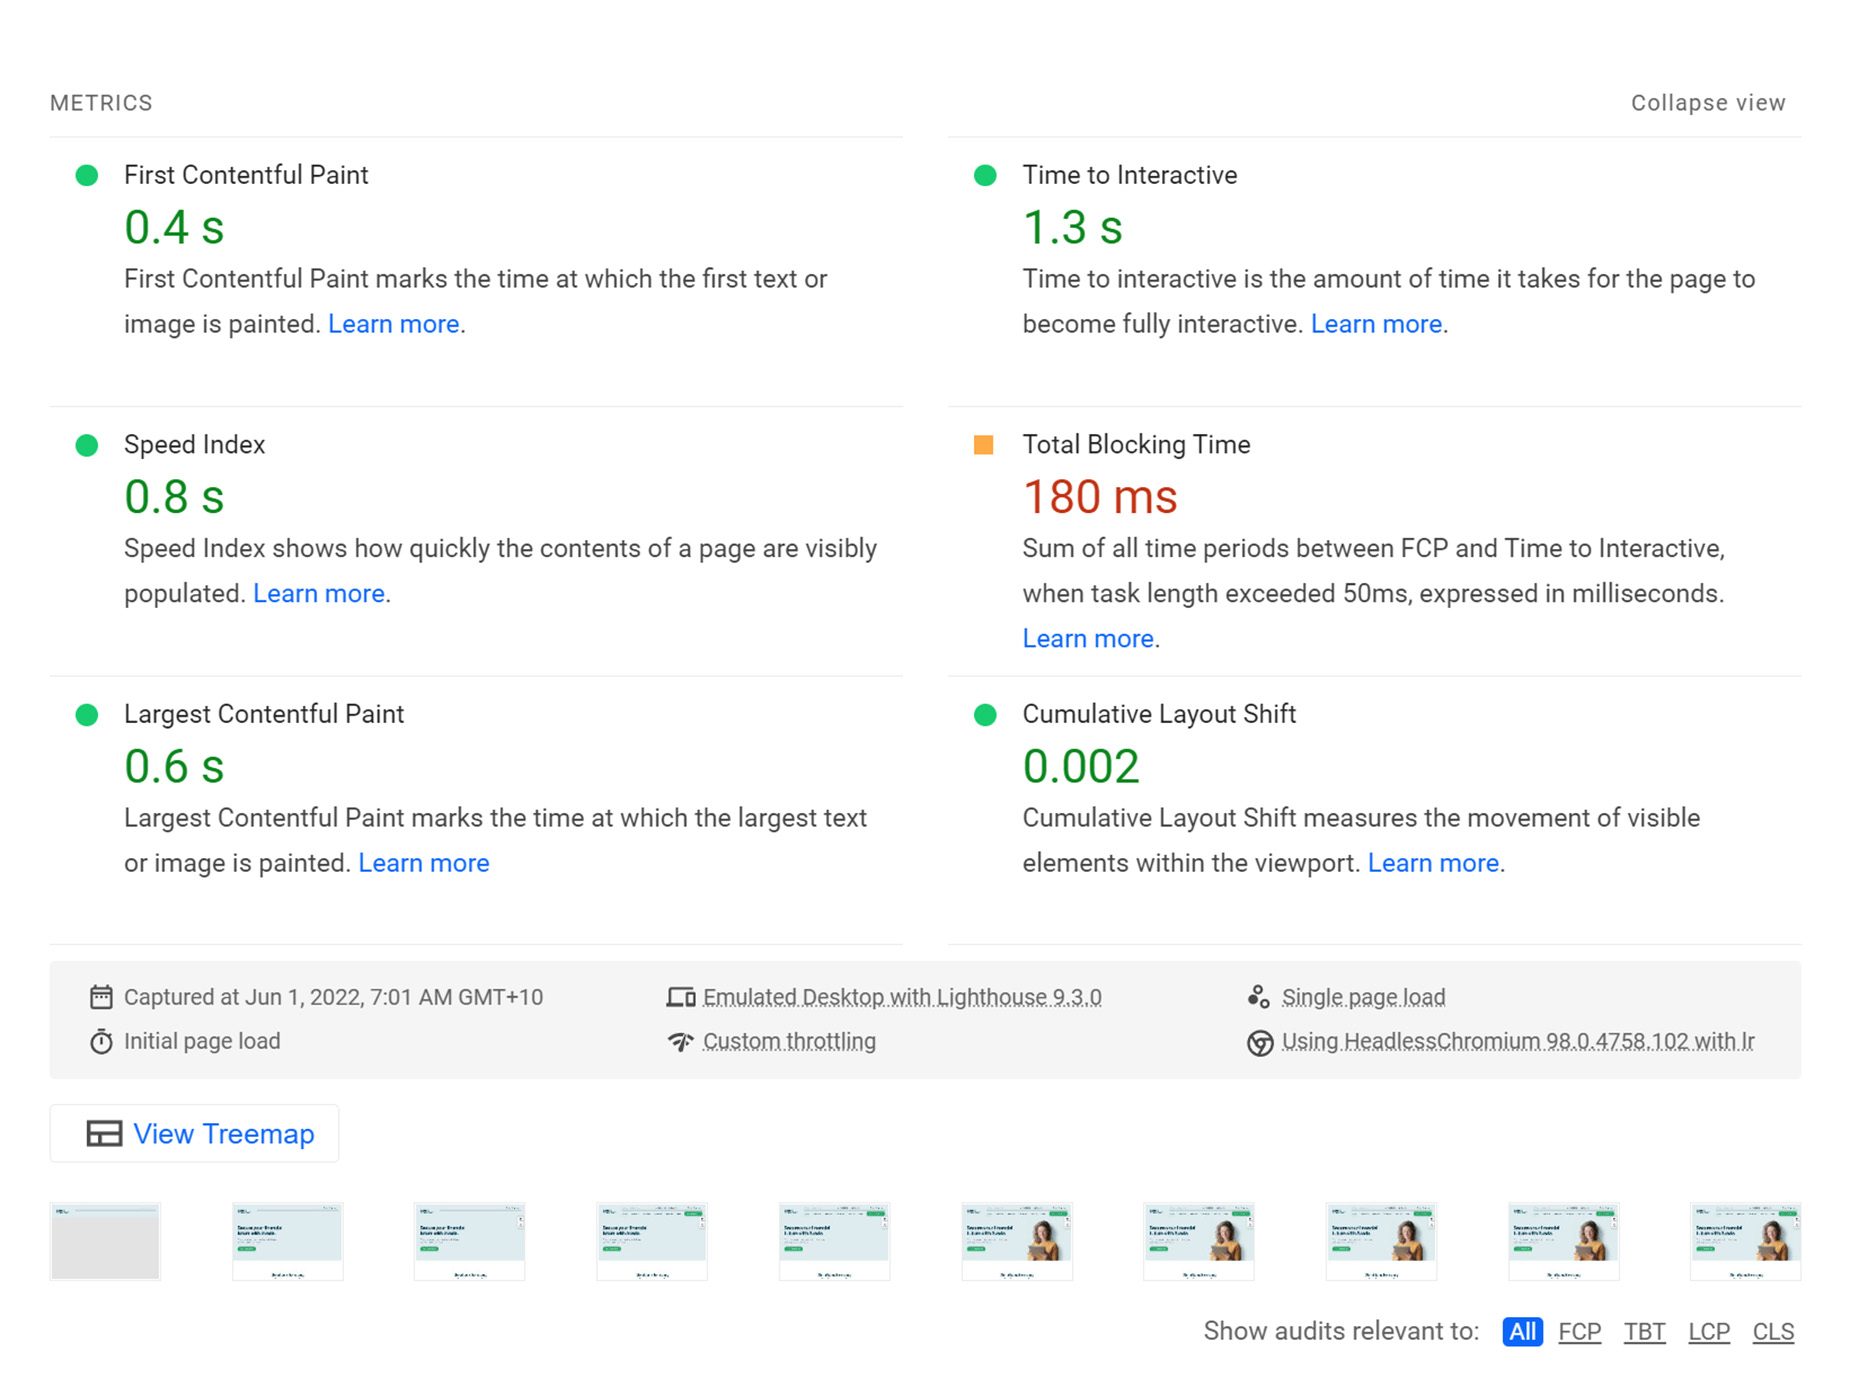
Metrics
Again, the Metrics section has a collapsed or expanded view. The expanded view has a description of the individual metric and a link to learn more about each one.
Below this, the test meta data is displayed, as well as a link to view a Treemap fo the pageload, a timeline view of the page load, and an audit filter. You can show all audits, or just audits relevant to a particular metric. Then come the individual audits.
PSI separates its audits into three sections:
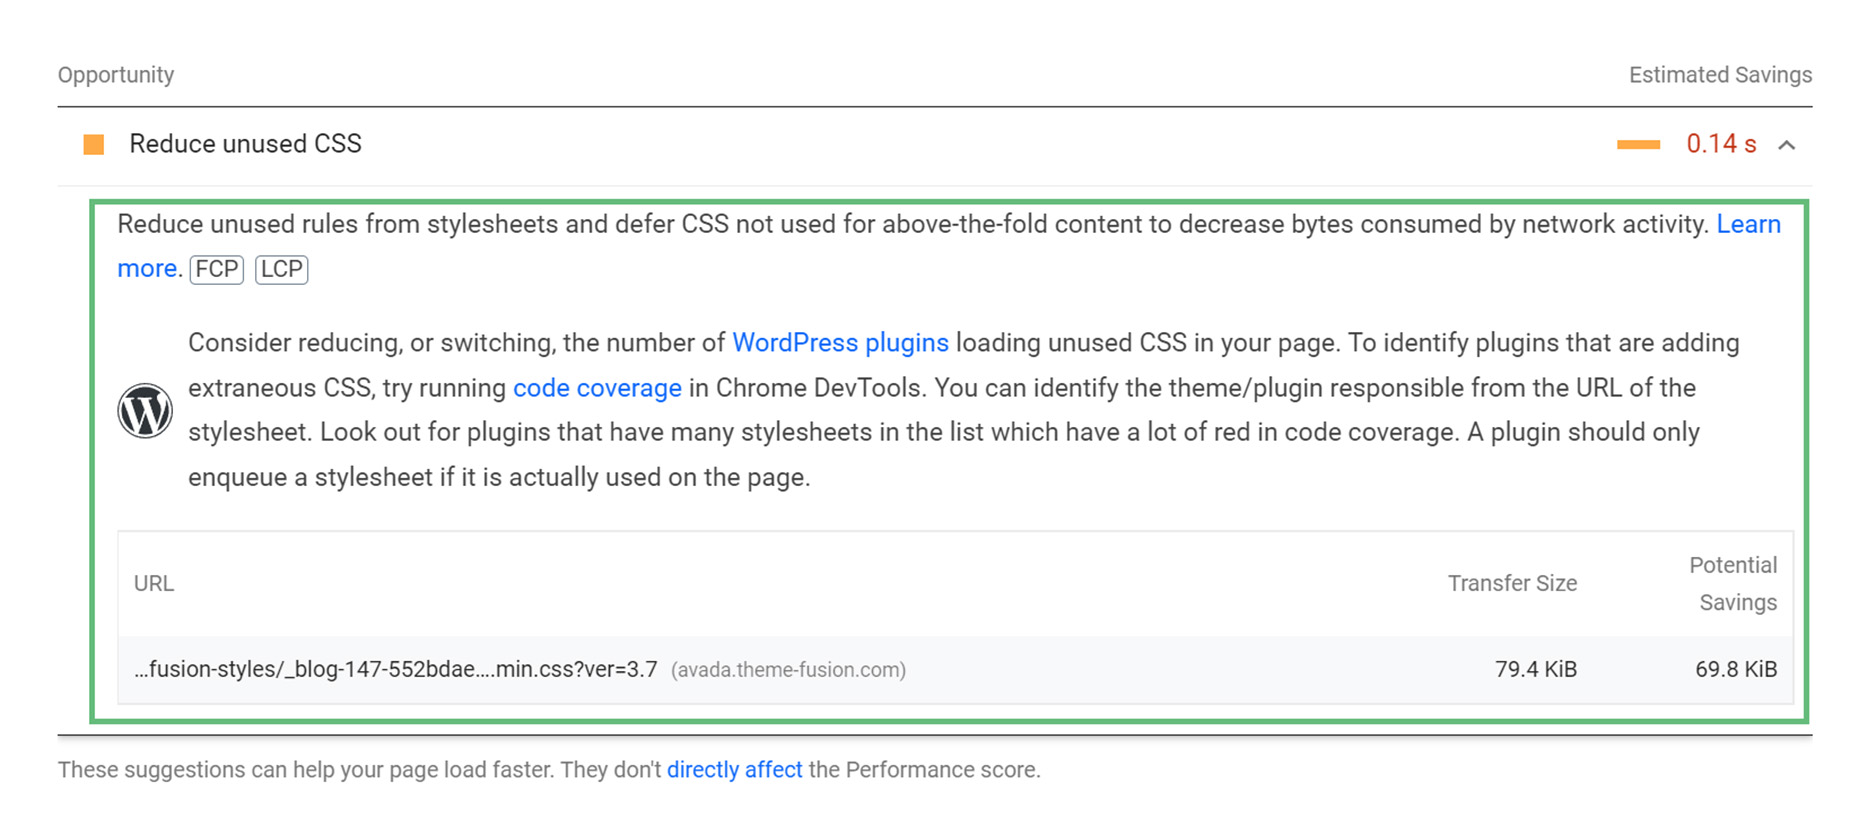
Opportunities
The Opportunities section is what it says on the label. This section provides developers with recommendations to improve a page’s speed and gives an estimation of the page speed gained. You can expand on the opportunities by clicking the small chevron on the right, and there is a link more more information about the particular issue.
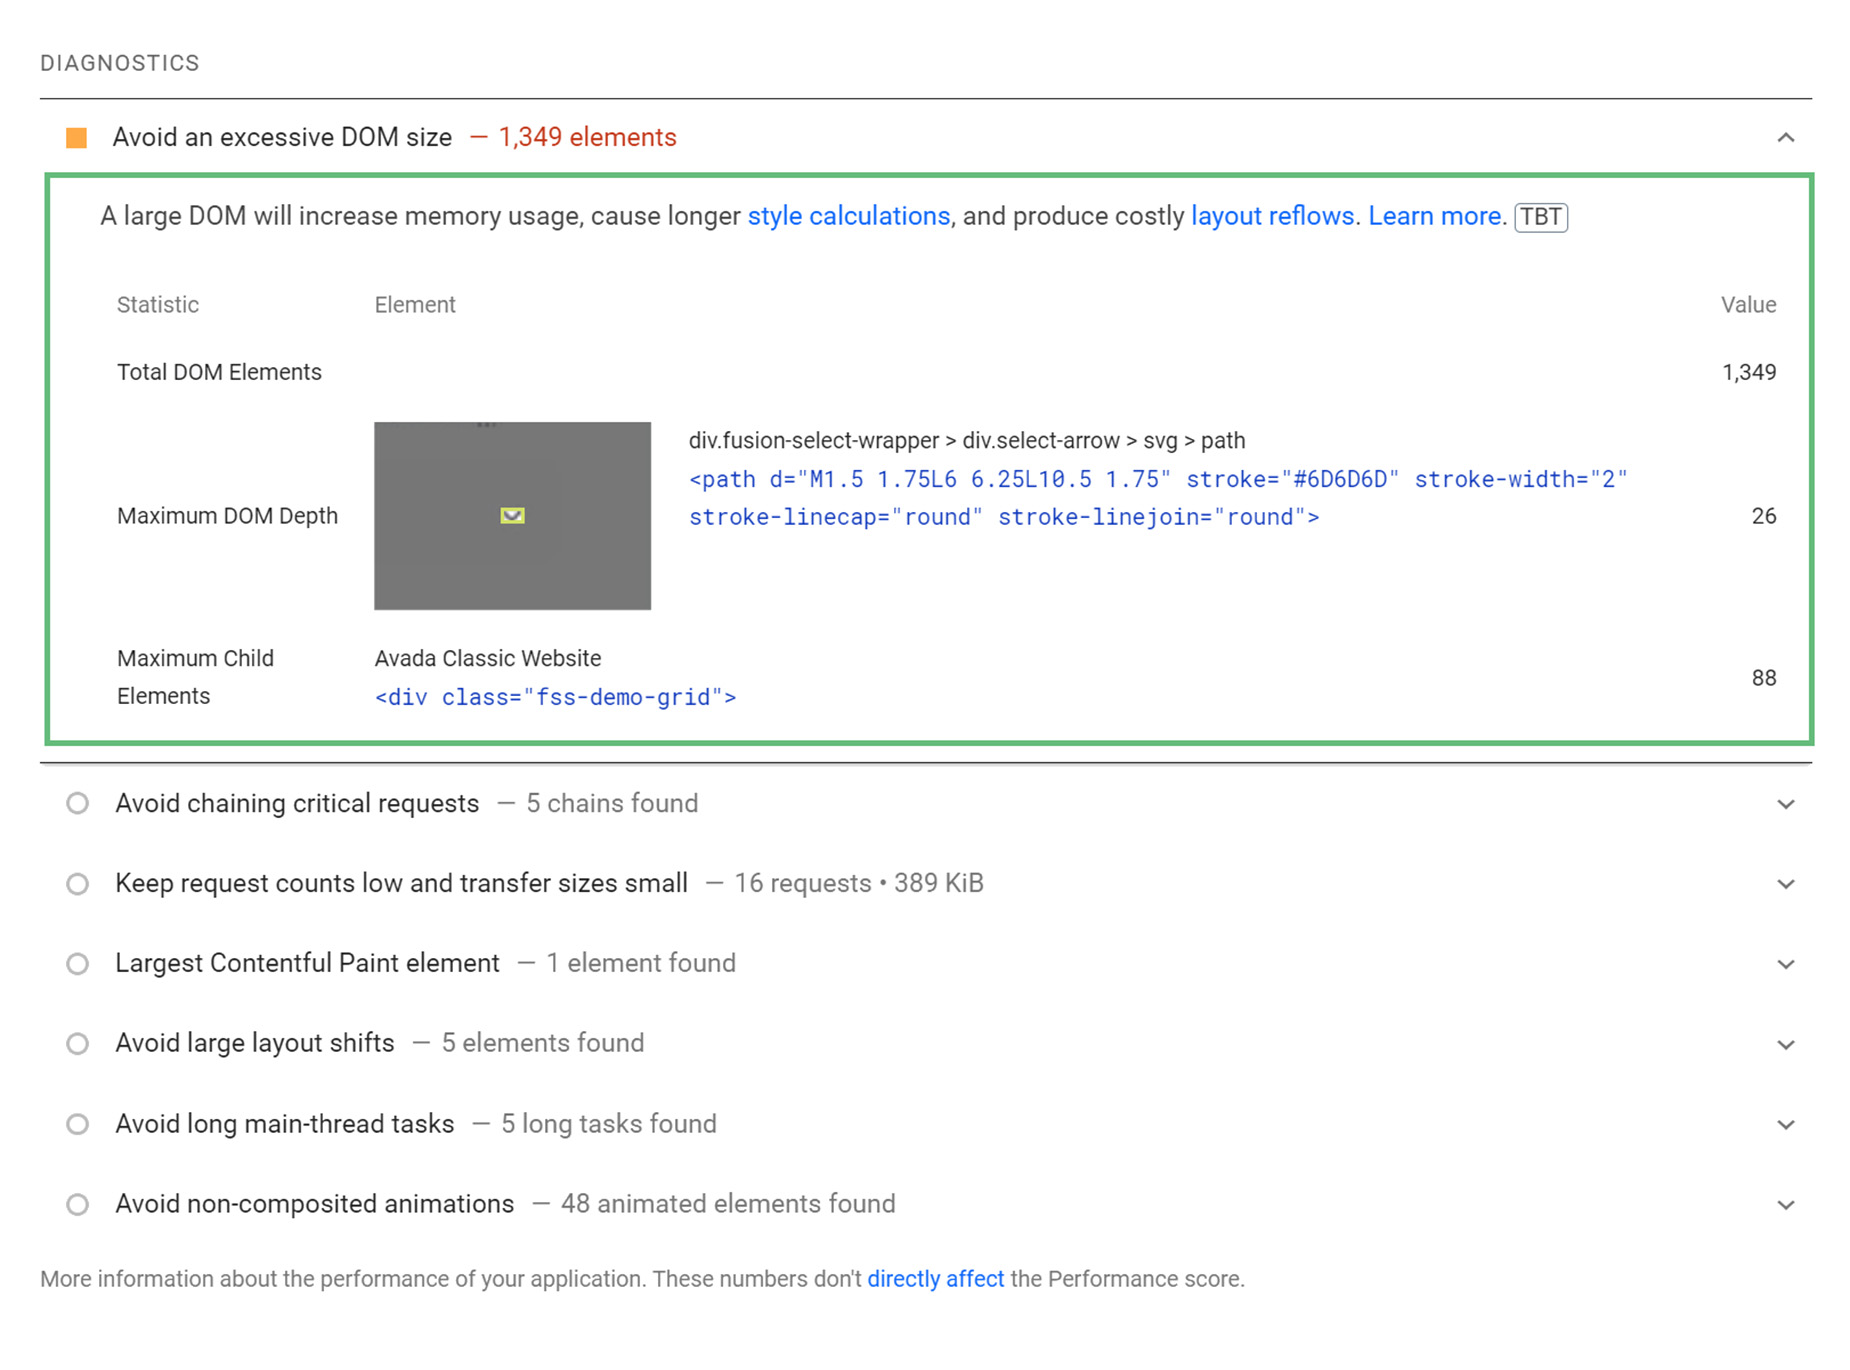
Diagnostics
Diagnostics supplies more information about the performance of a page as well as other recommendations to improve a page’s speed. Likewise, the Diagnostics section can be expanded one point at a time, with further information and links to even more.
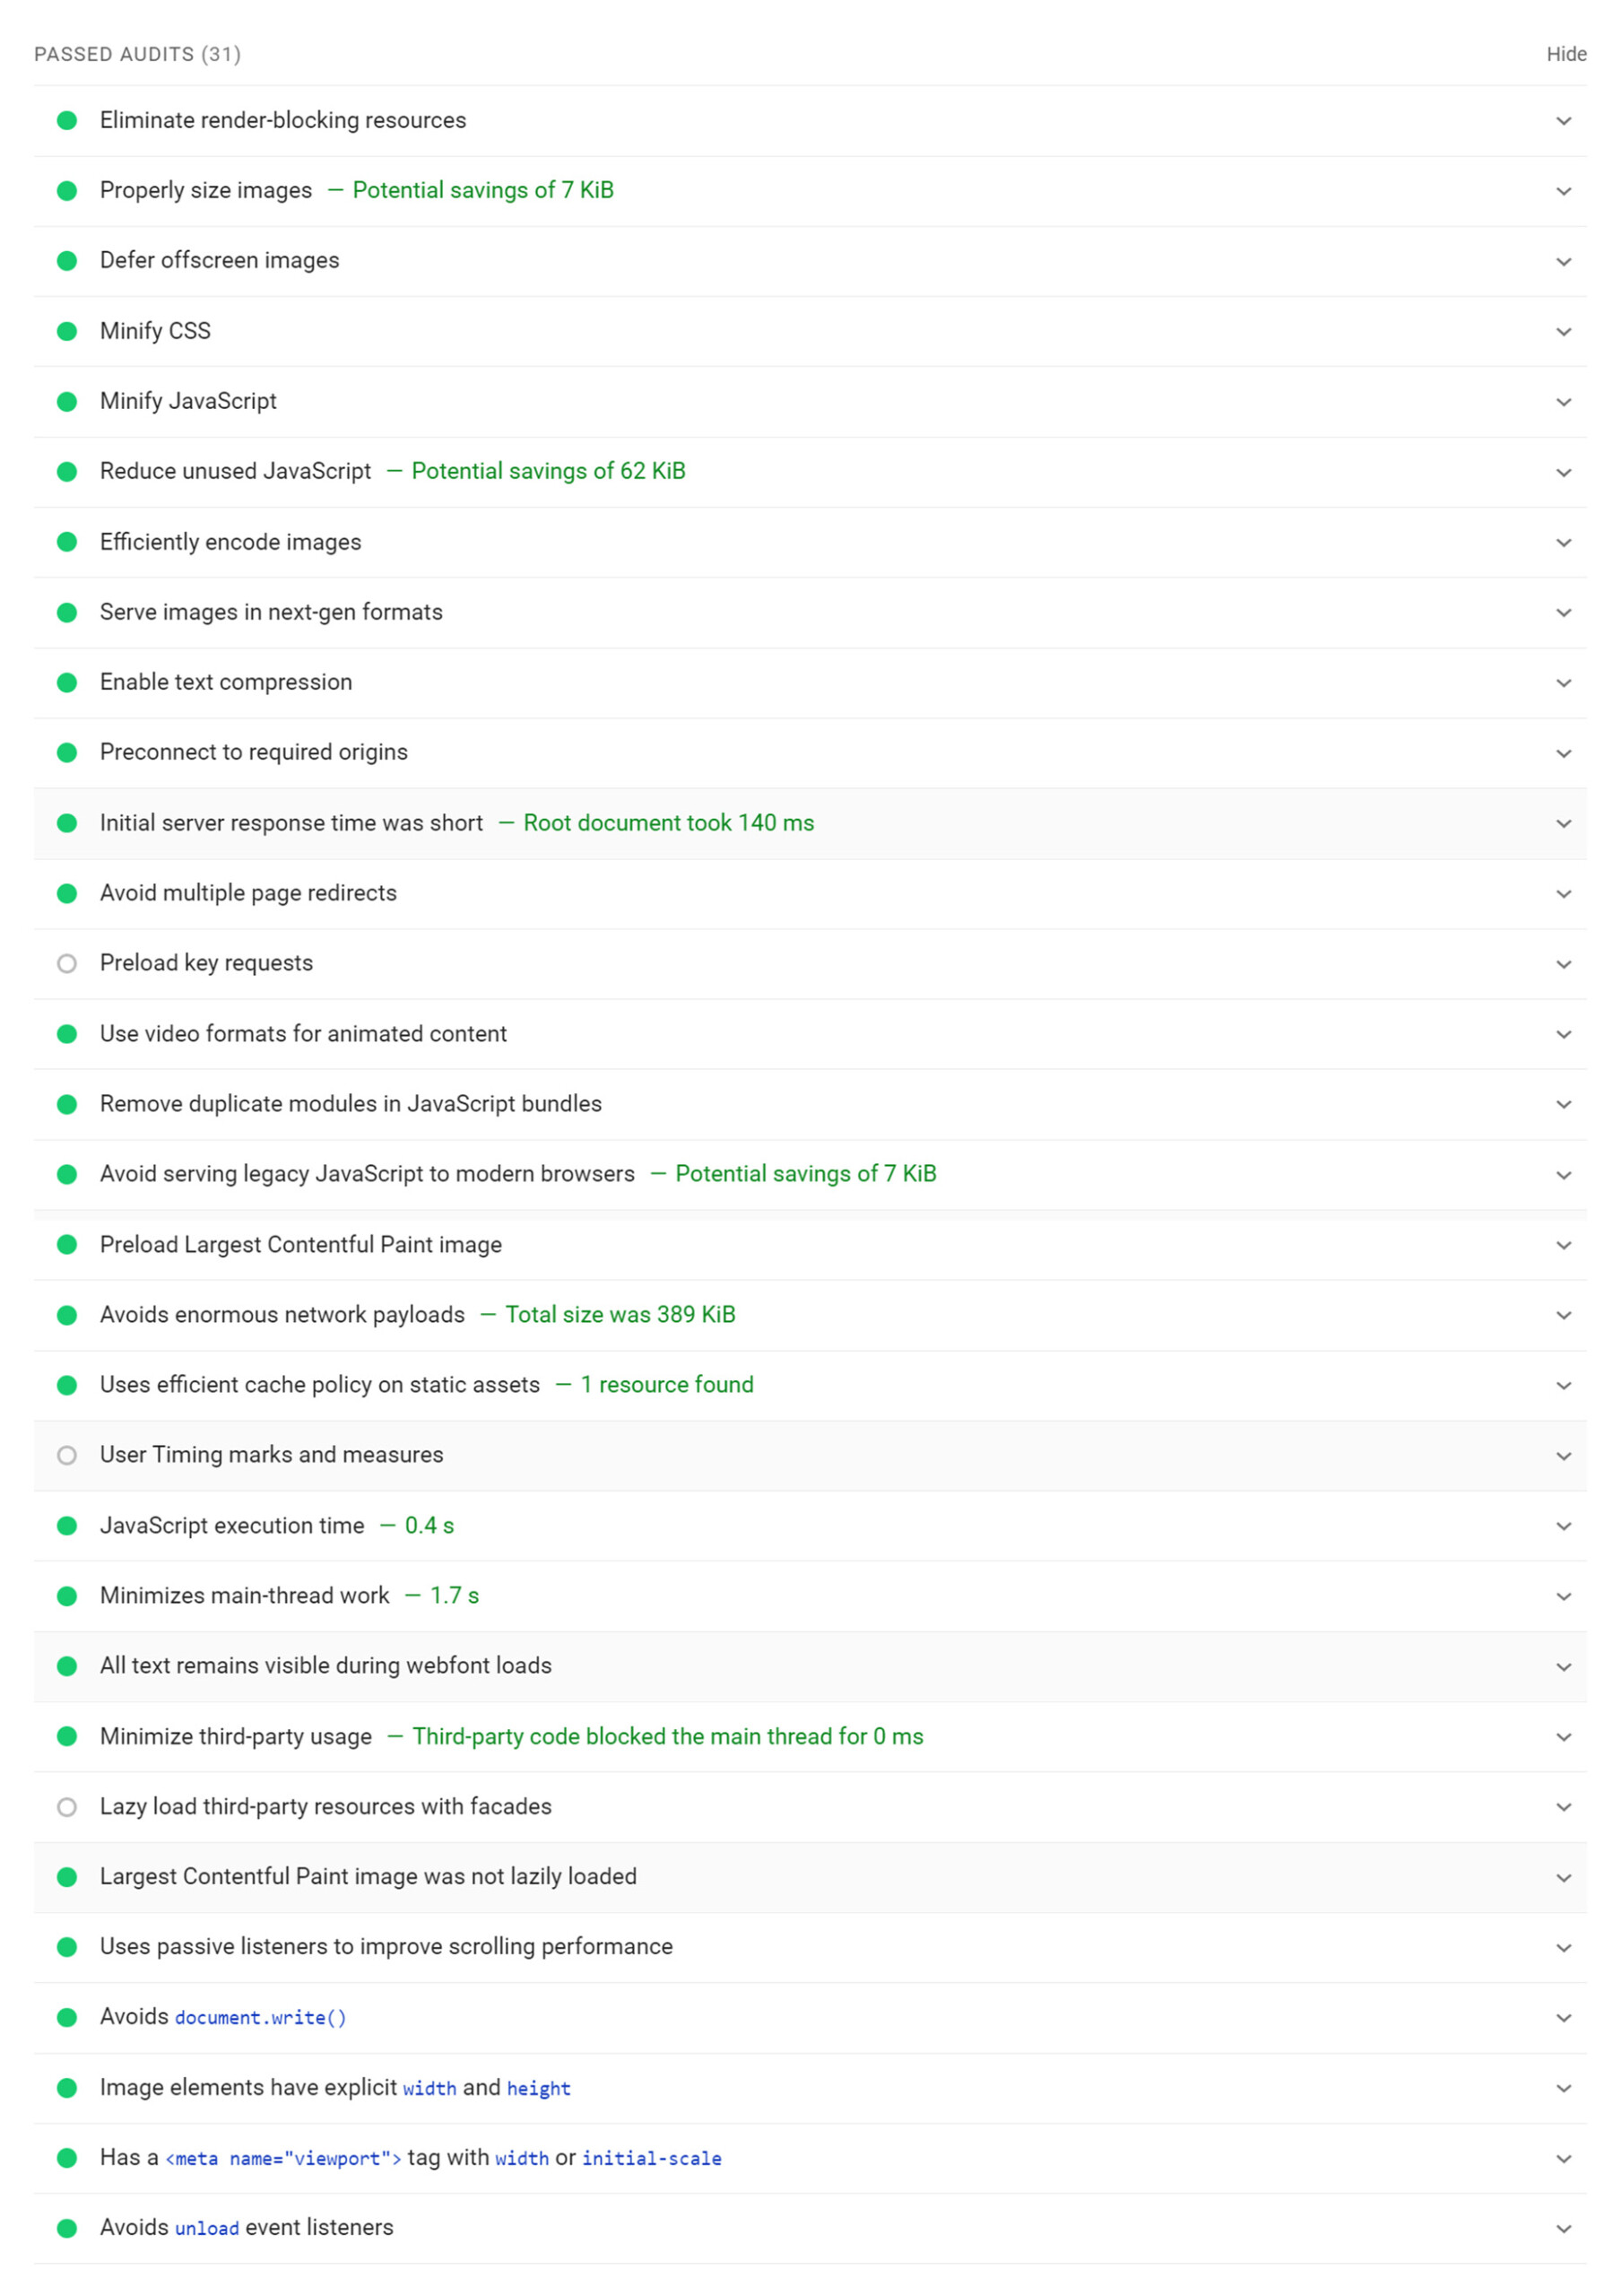
Passed Audits
The final section, Passed Audits, is useful as it tells developers the audits that the page has passed on. These individual audits can also be expanded to show more details.
Common Issues
Conclusion
Google PageSpeed Insights is a valuable tool to help detect and remedy issues that may be affecting your websites’ load time. It does however require time, patience and expertise. There are also other similar services like GTMetrix, Pingdom, and WebPagetest.
Remember, due to hosting and content variables, site optimization is a very complex area, and falls well outside of the support we can provide for Avada.
The Facebook Avada User’s Group has a large and very active membership, and this topic is regularly discussed on the Group.