Performance Testing using GTMetrix
Last Update: November 3, 2025
We all want our websites to load quickly, and there are a number of services out there to help us test, evaluate, and fix various issues affecting the loading speed of our pages. In this series of docs, we will be looking at the major players in this area, Google PageSpeed Insights, GTMetrix, Pingdom and WebPageTest, and how they can help you improve the loading speed of your Avada website. Read on!
GTmetrix
GTMetrix is a popular online tool to analyse the load speed and performance of a web page. You can use the service without being logged in, but to take advantage of the full range of free features, you need to sign up for a free account. There is also a different plans, but the free plan is more than enough for the majority of users.
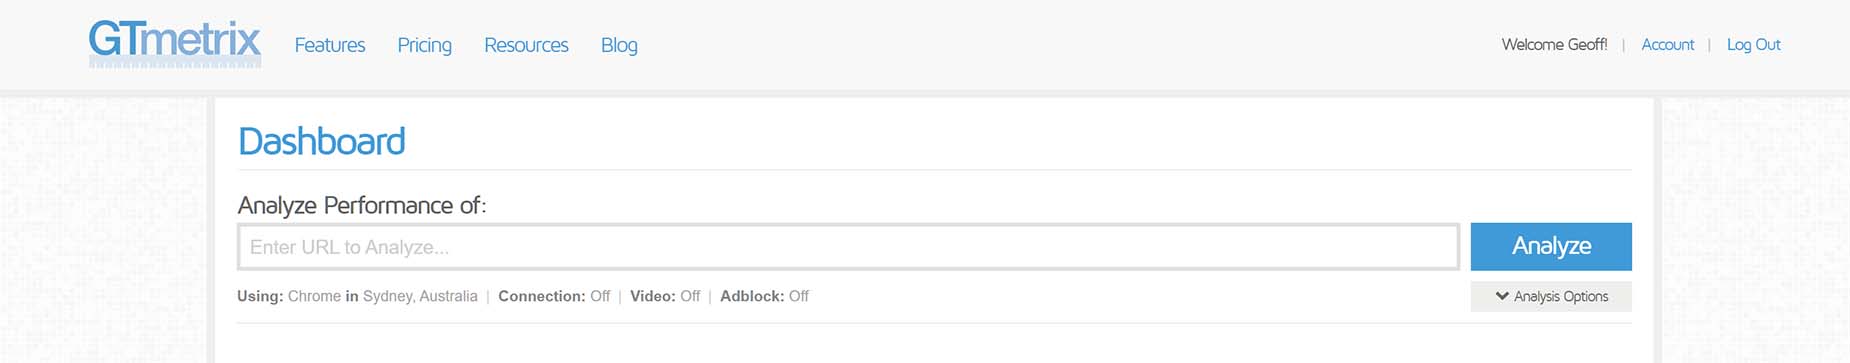
When you visit the site, you are immediately welcomed and invited to get straight to work, with an address bar to input the URL to test. As their website notes “GTmetrix gives you insight on how well your site loads and provides actionable recommendations on how to optimize it.”

Analysis Options
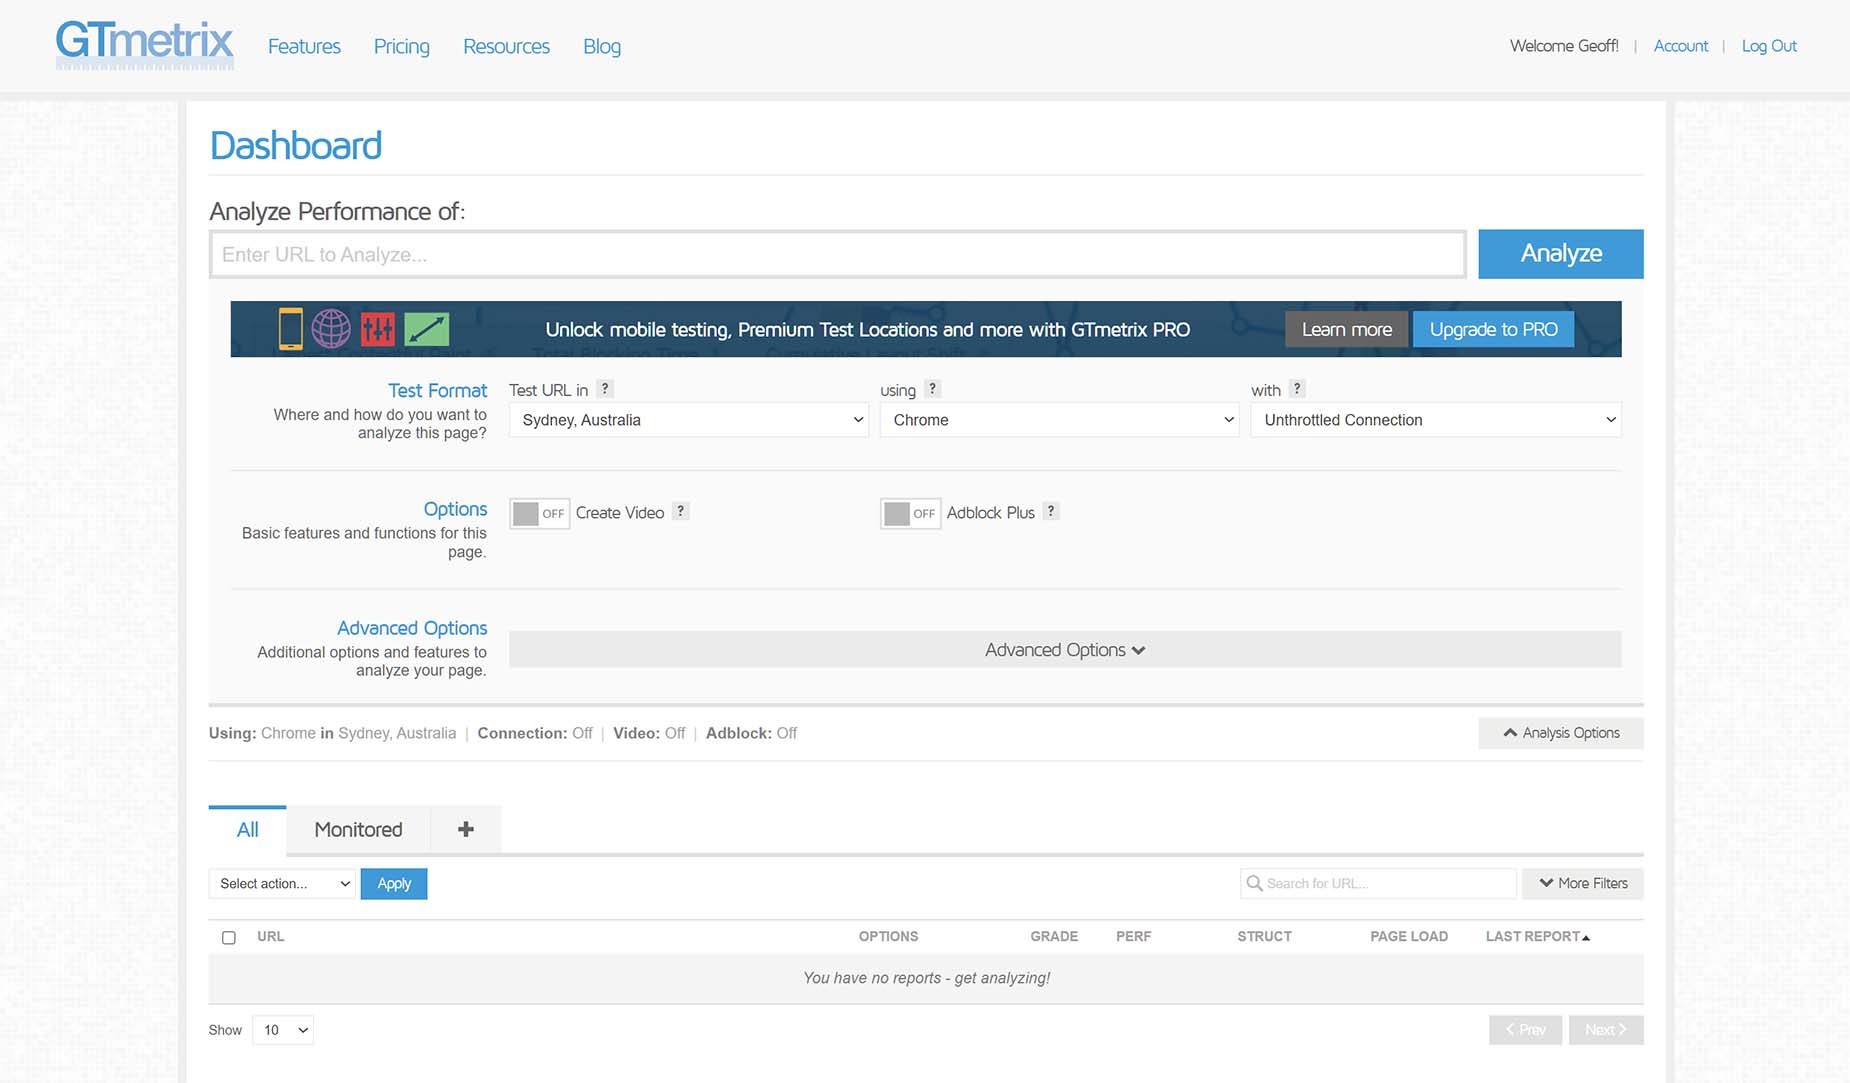
If you choose to sign up for a free account and log in, you have many more options to customise your tests, including the browser used, the type of connection, and the location of the tests, which can be very useful if you have a local customer base.
Directly under the URL field, you will find a number of clickable options for that particular test. You can click directly on them to make fast changes to your analysis options.
If you click the Analyse Options on the far right, this will expand to the full options set, where you can choose the following options.
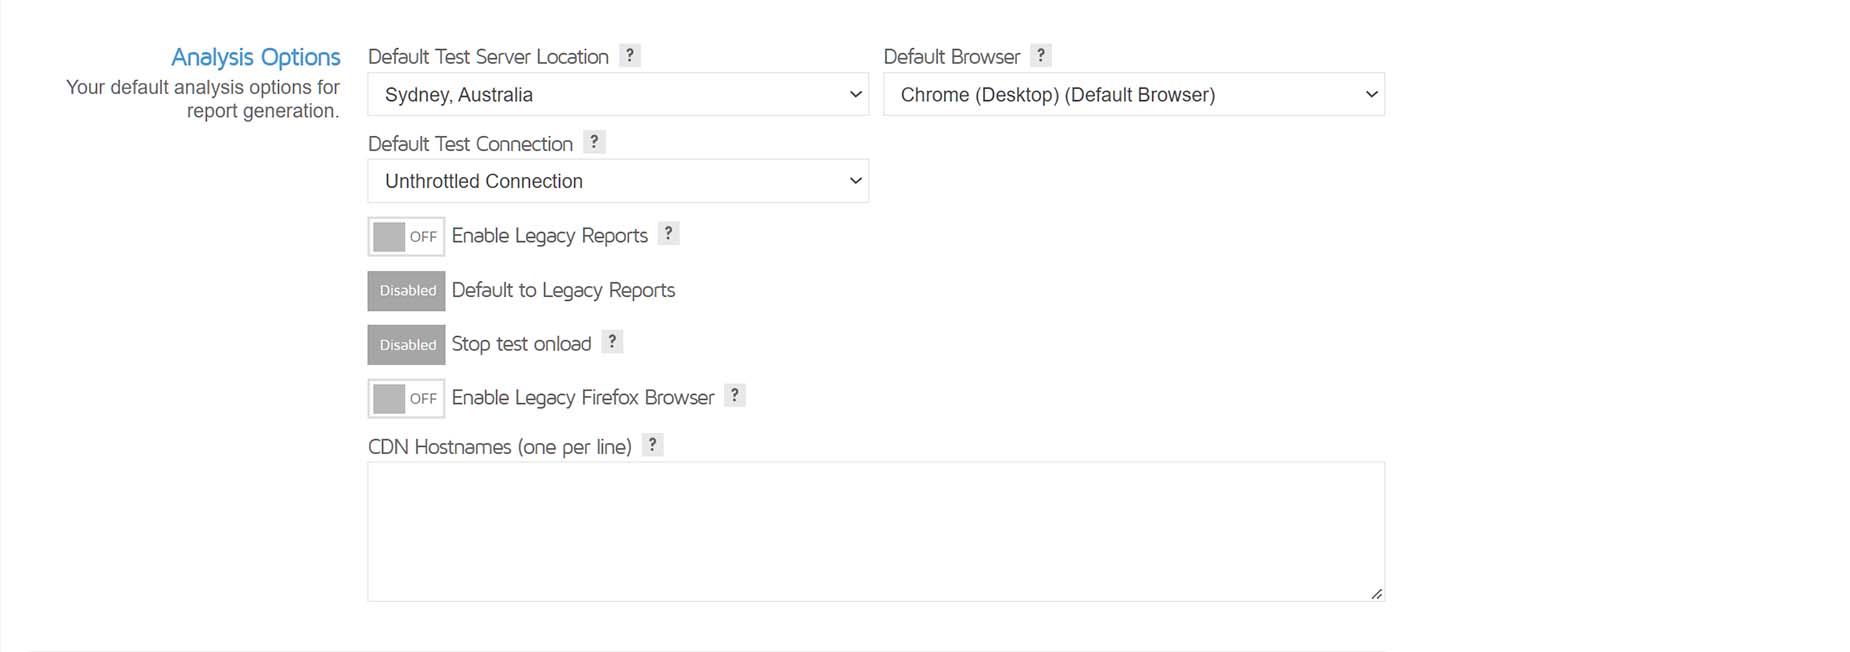
It must be noted that these home page options are for individual tests. If you’d like to set your default options for page analysis, head to your Account, linked at the top right of the site, and make your choices in the following dialog.
Performance Report
Once you have set your options, and entered a URL, you click the Analyse button, and GTmetrix goes to work. When the job is completed, you are presented with a Performance Report. This summarizes your page performance, based off key indicators of page load speed into two areas – the GTmetrix Grade, and Web Vitals.
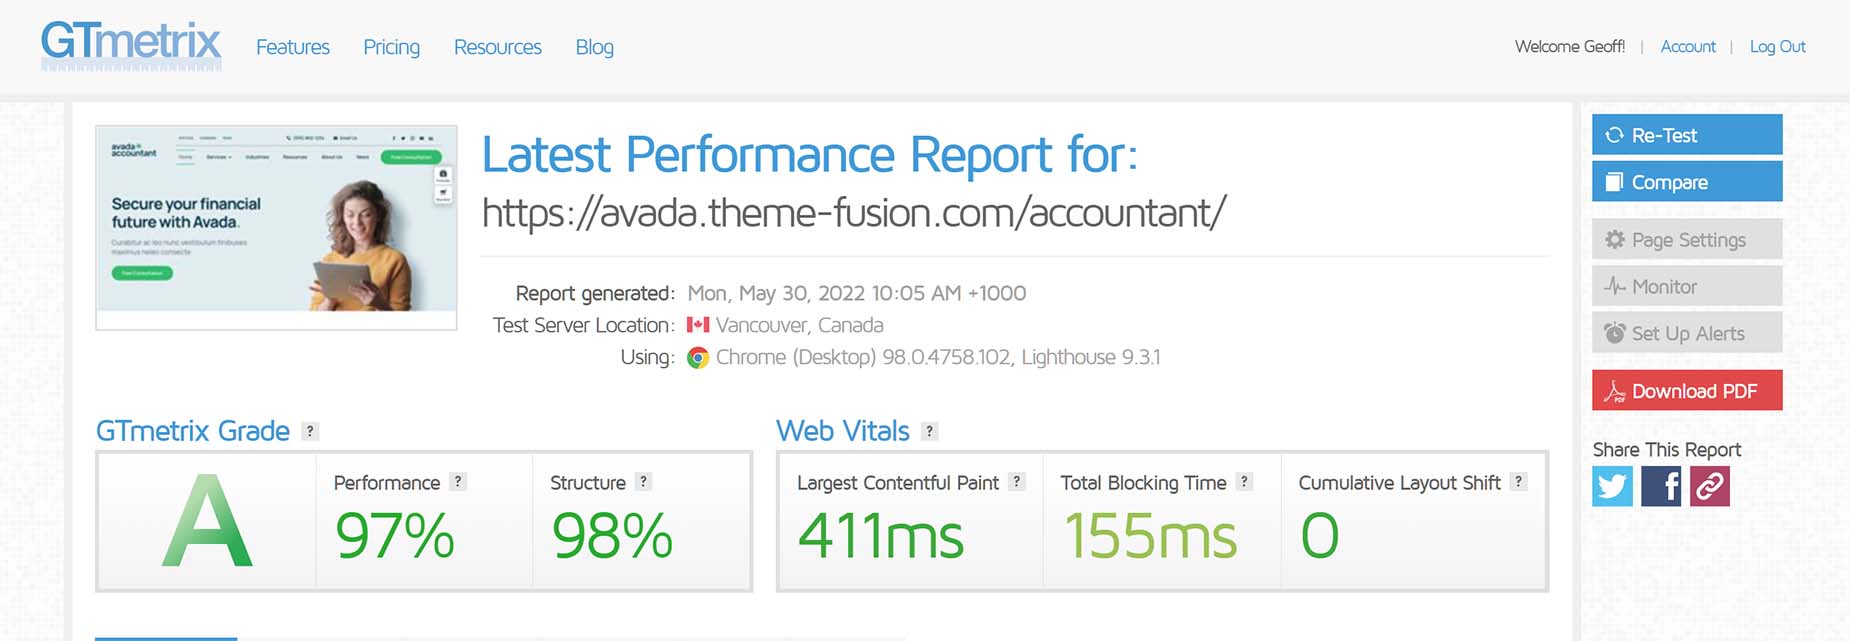
GTmetrix Grade
Web Vitals
Result Tabs
Summary
The individual tabs under the Performance summary area, are where you can see what specific areas your website is performing well, or poorly, in. The Summary Tab provides a Speed Visualisation of your site’s loading time, and below this lists the Top Issues, with the results and recommendations on the individual audits. They are ranked with an impact rating, showing the highest impact issues first. There is a link at the right to see the complete list of structure audits, and you can also see these on the Structure Tab.
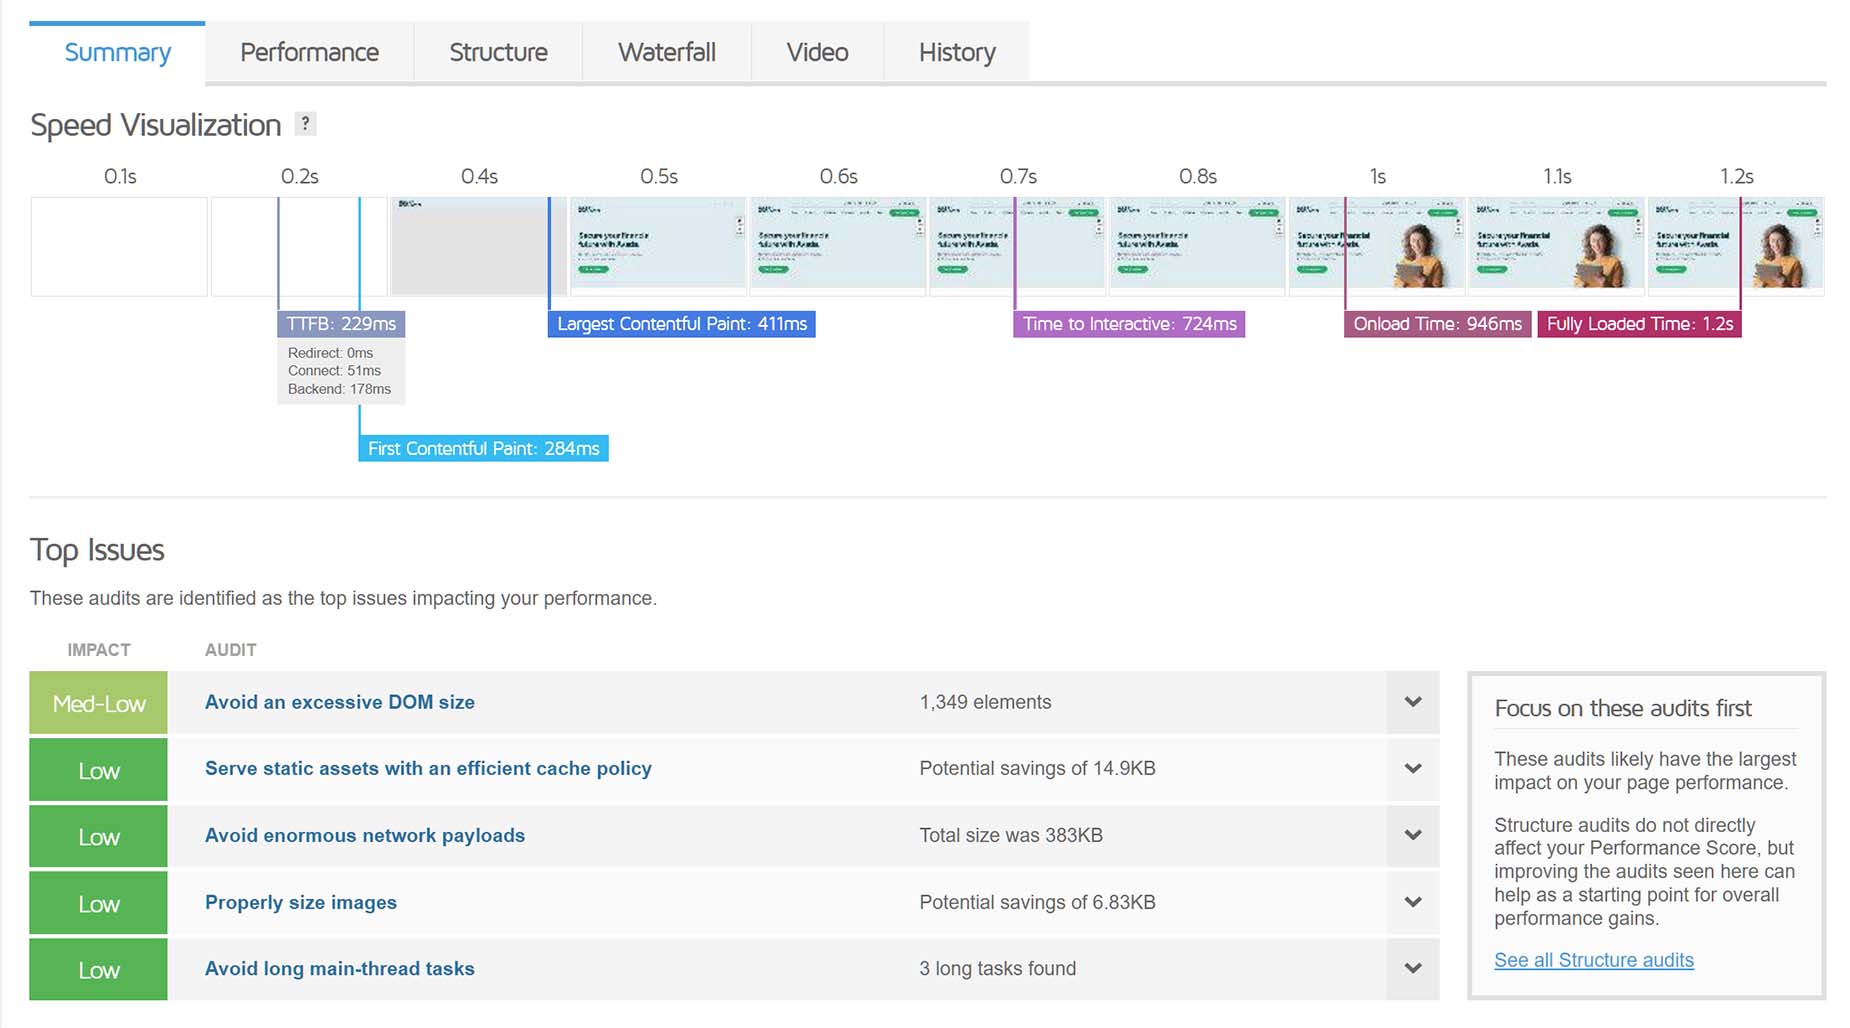
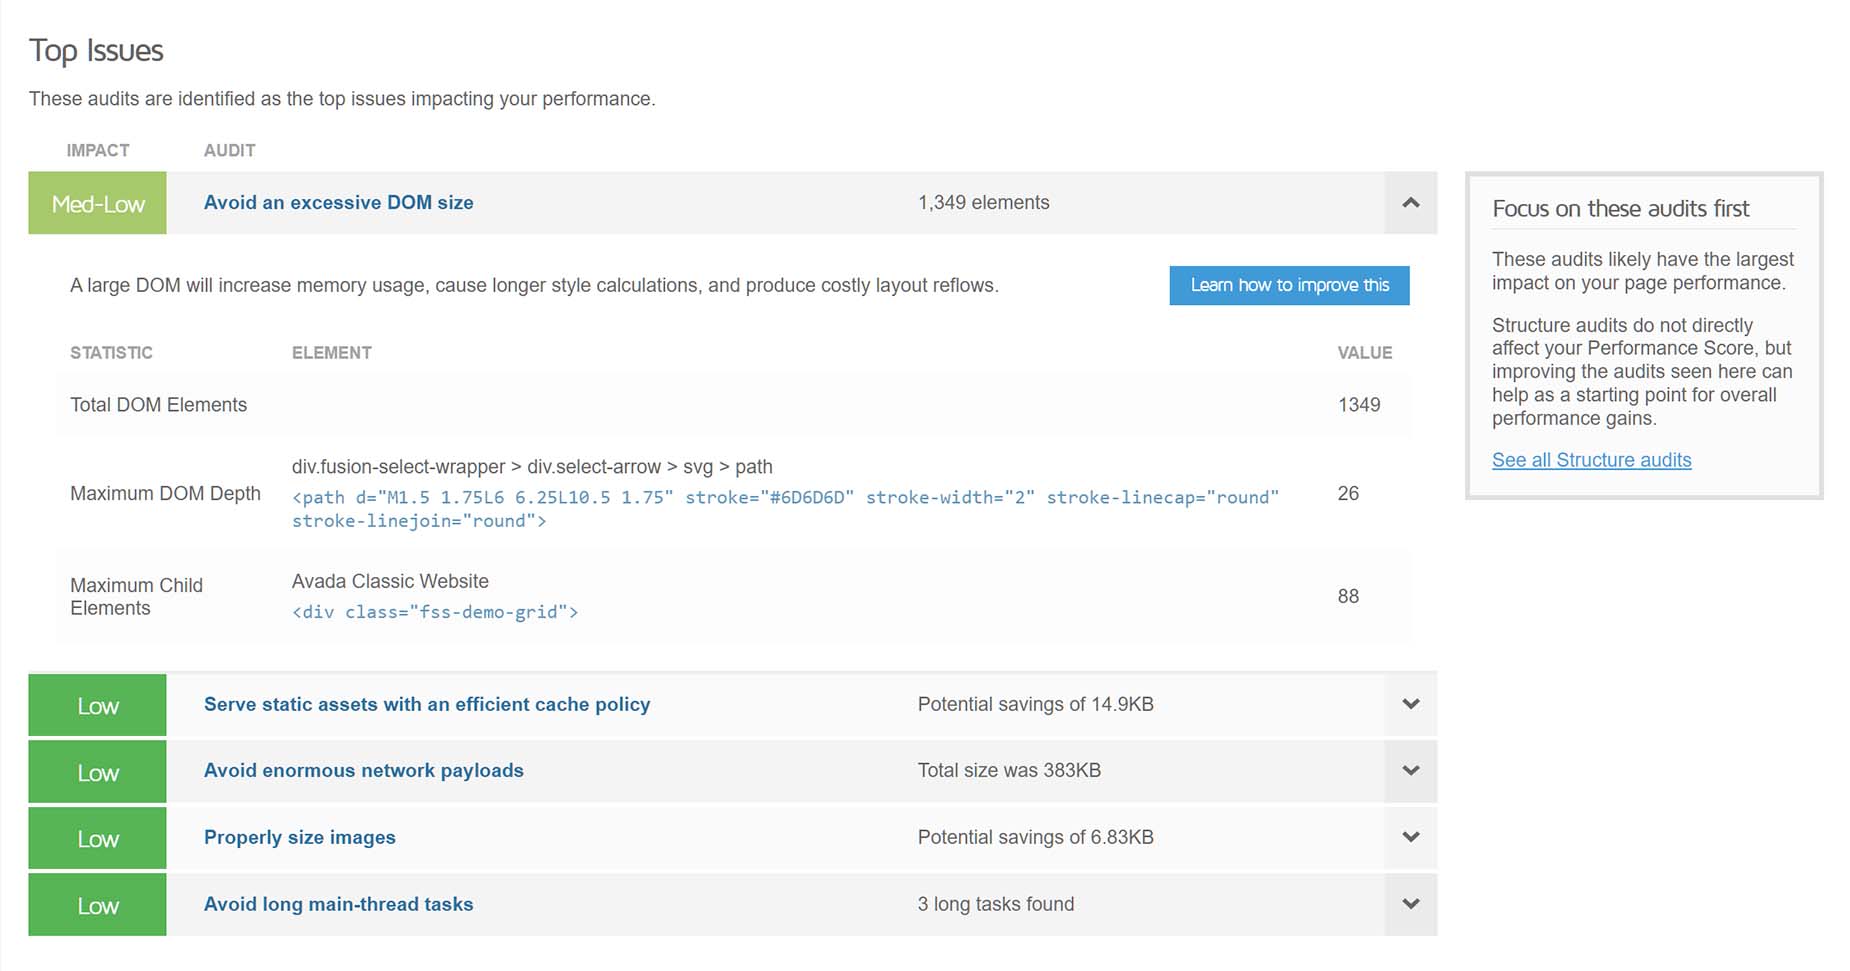
Using the small arrow on the far right of each individual audit result, you can expand the section to see more details, as well as links to further information on how to improve the result.
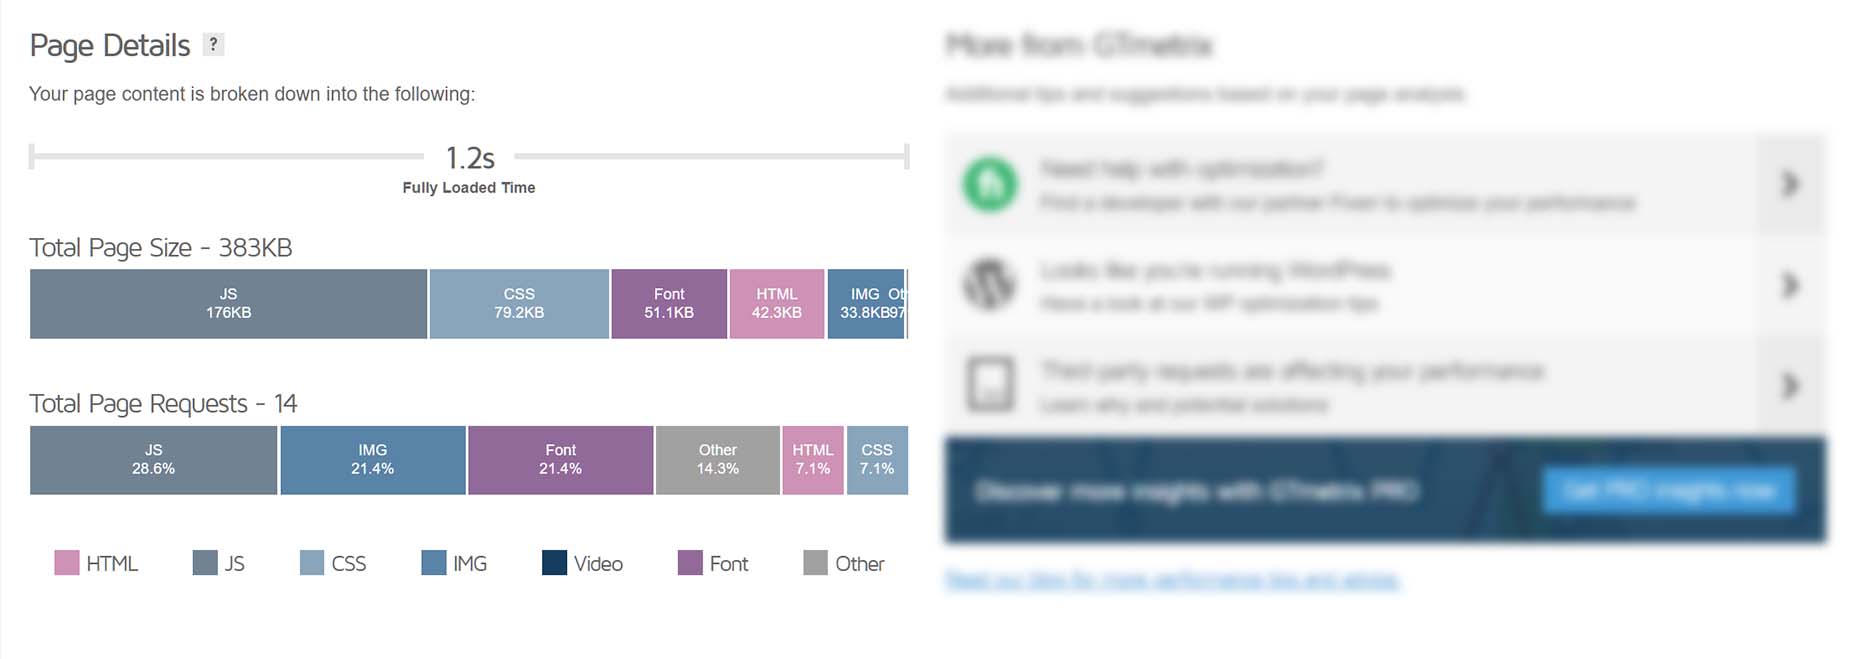
Finally, at the bottom of the Summary Tab, you can see a section called Page Details. This breaks down your page content by bith request type and size. You can hover over a segment to see additional information on that request type so that you can understand if your page is heavy on JavaScript, images, video etc.
Performance
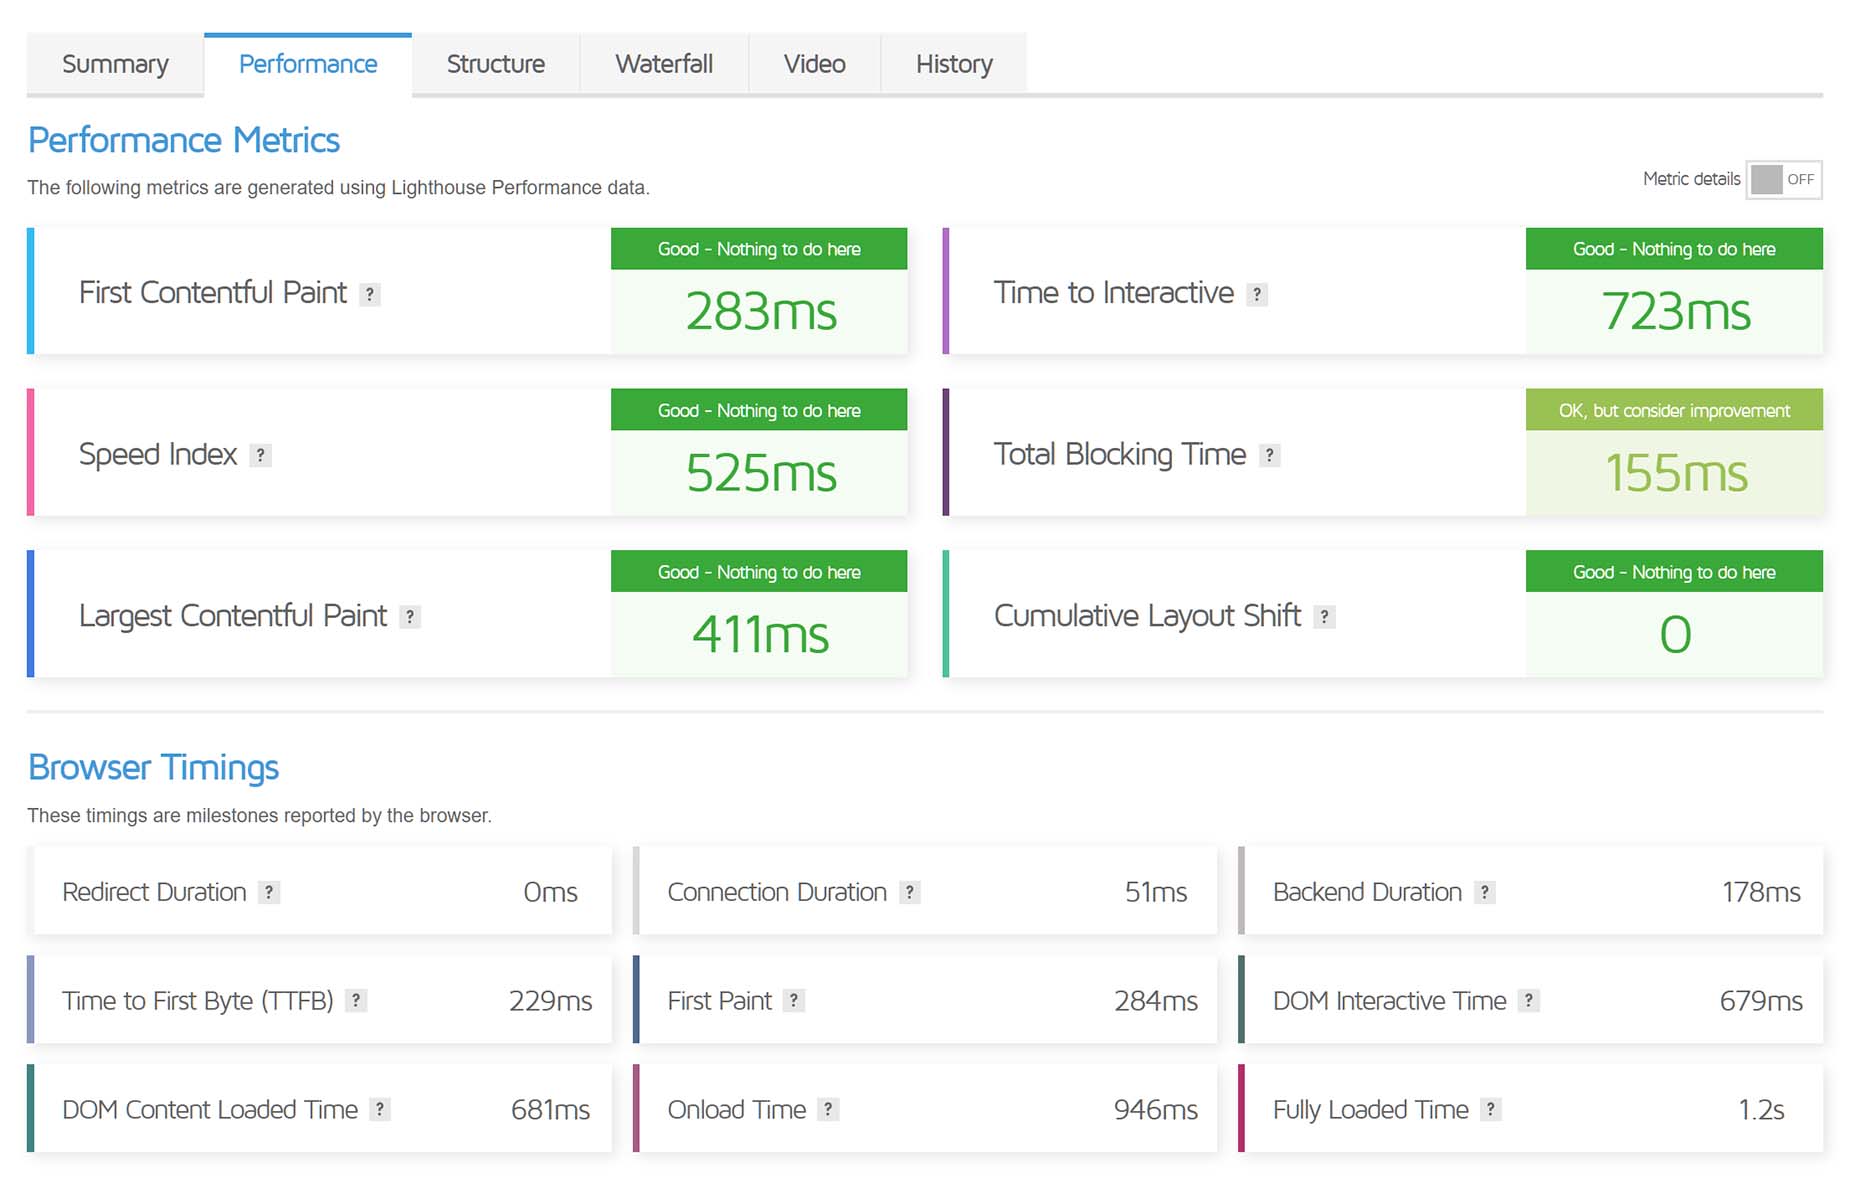
The Performance Tab shows the Performance Metrics generated using Lighthouse Performance data, and the Browser Timings, as reported by the browser.
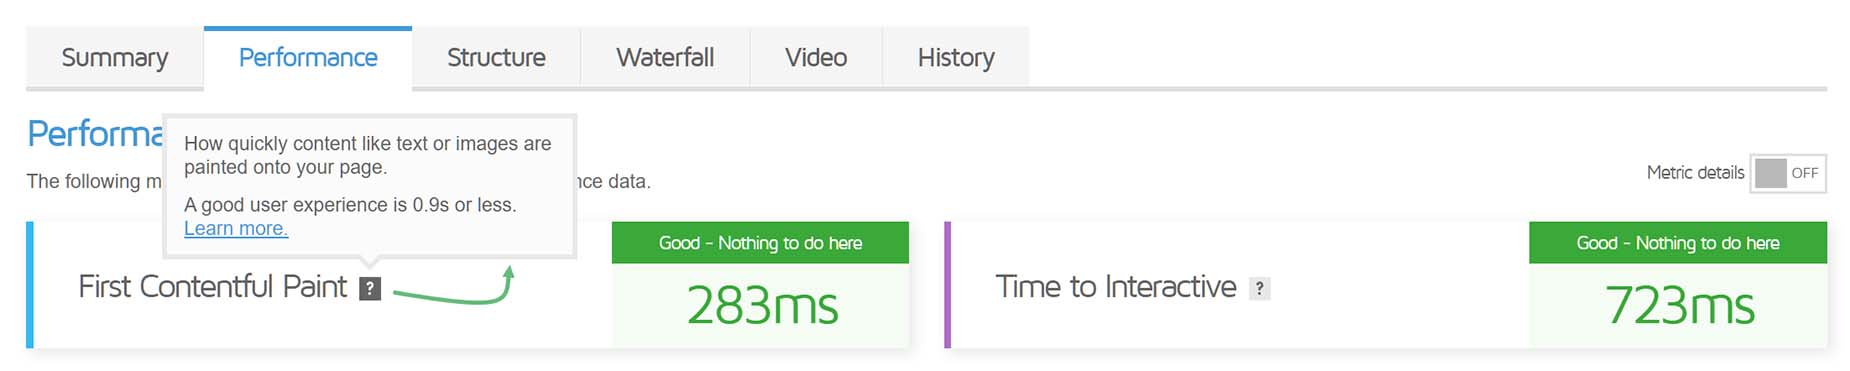
If you mouse over the individual metrics, you can see more information and links to learn more.
Structure
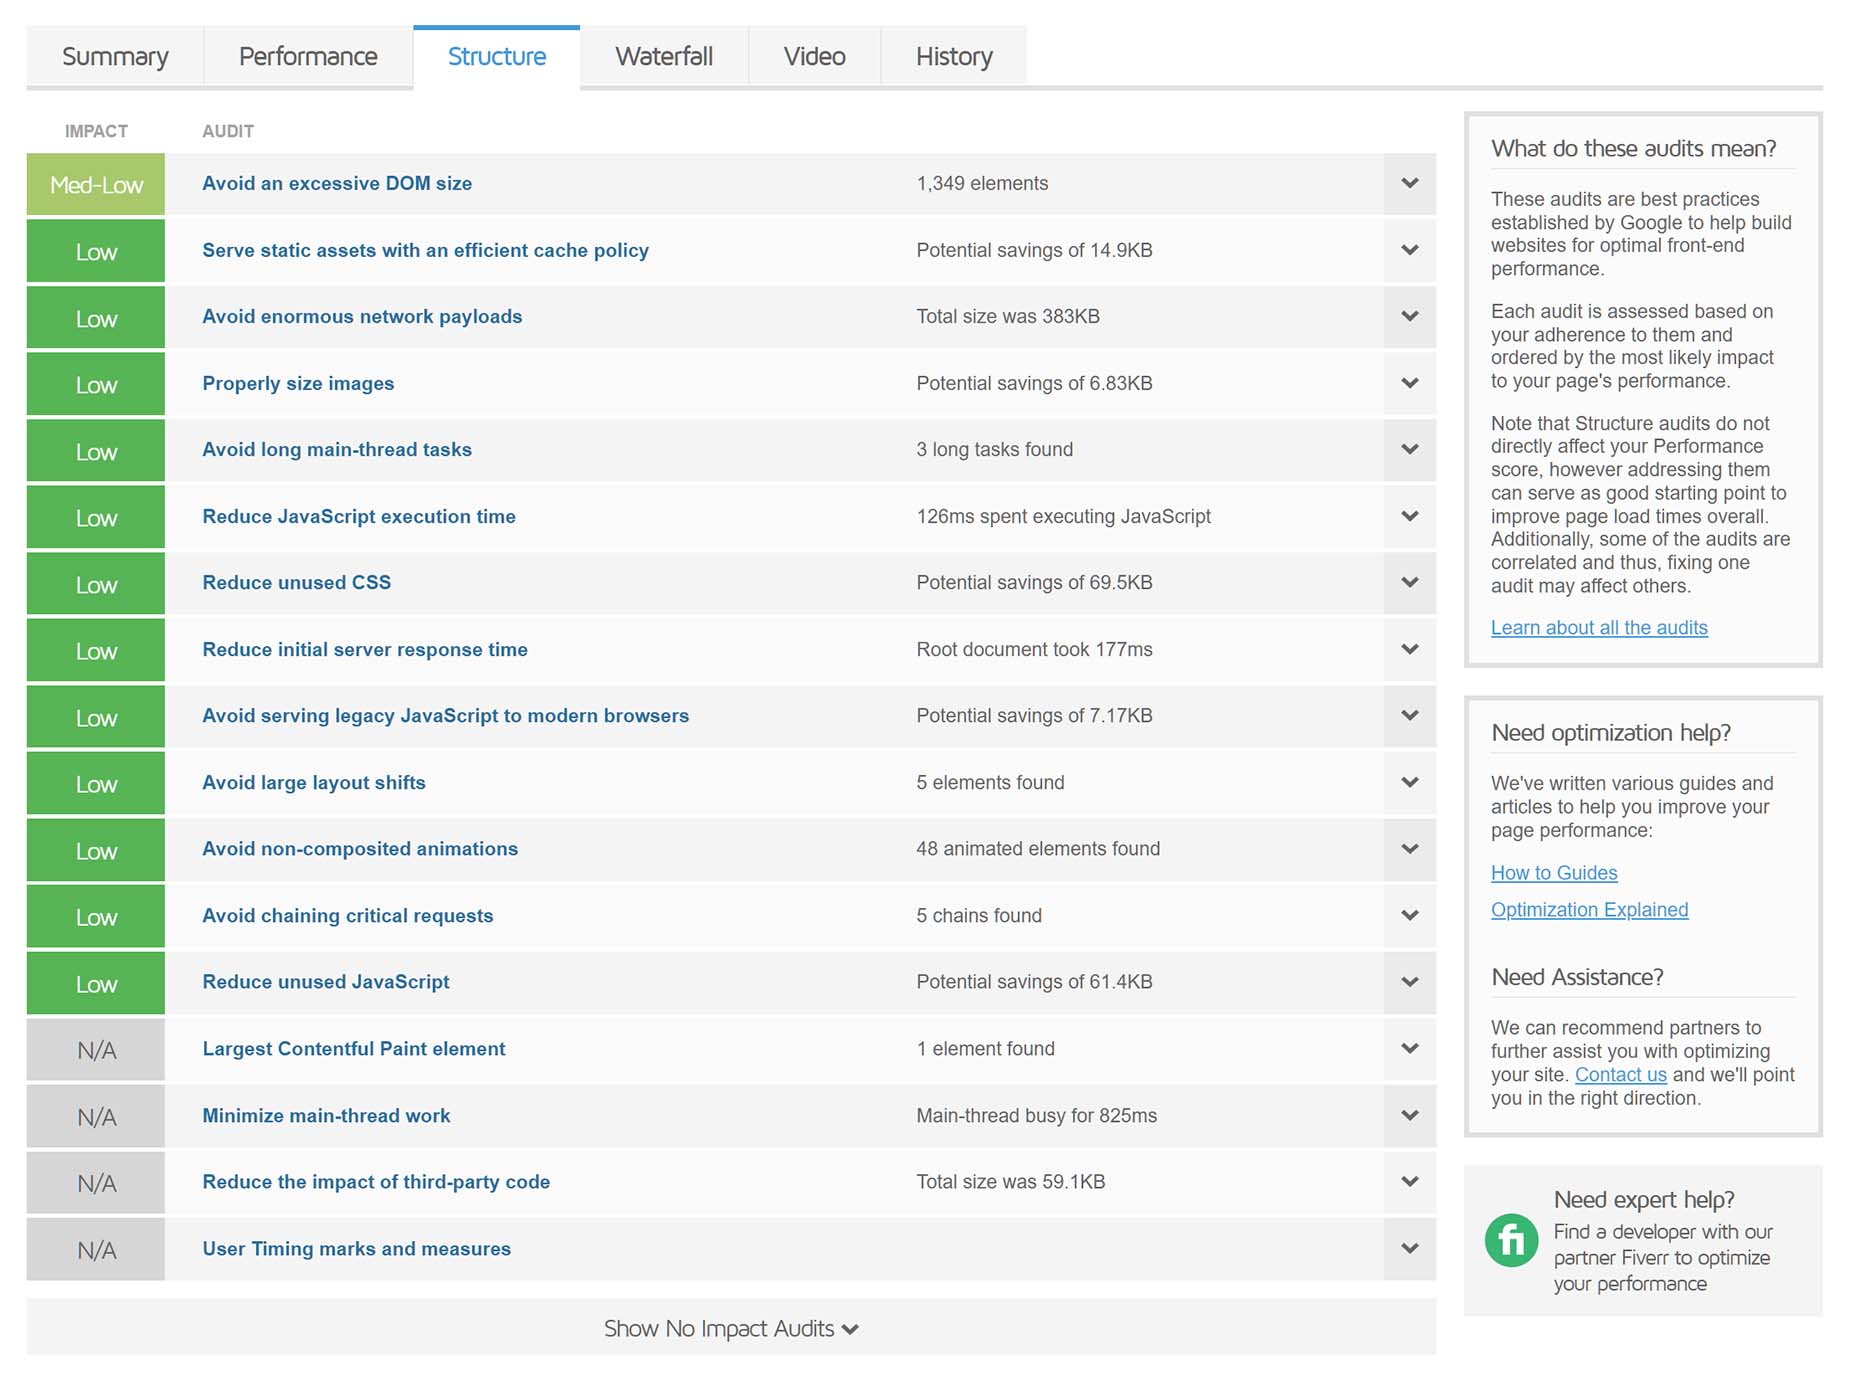
The Structure tab shows all meaningful audits, as well as displaying a link to display the No Impact Audits. Just like the Summary tab, you can expand each audit to see more details and to get links to more information.
Waterfall
The Waterfall tab shows a visualization of content loading behavior. It displays the request-by-request loading behavior of your website. Every script, media file, and/or third-party resource your page requests is displayed here.
If you don’t have experience with these charts, they can be overwhelming. Start by reading this How to Read a Waterfall Chart for Beginners document from GTmetrix.
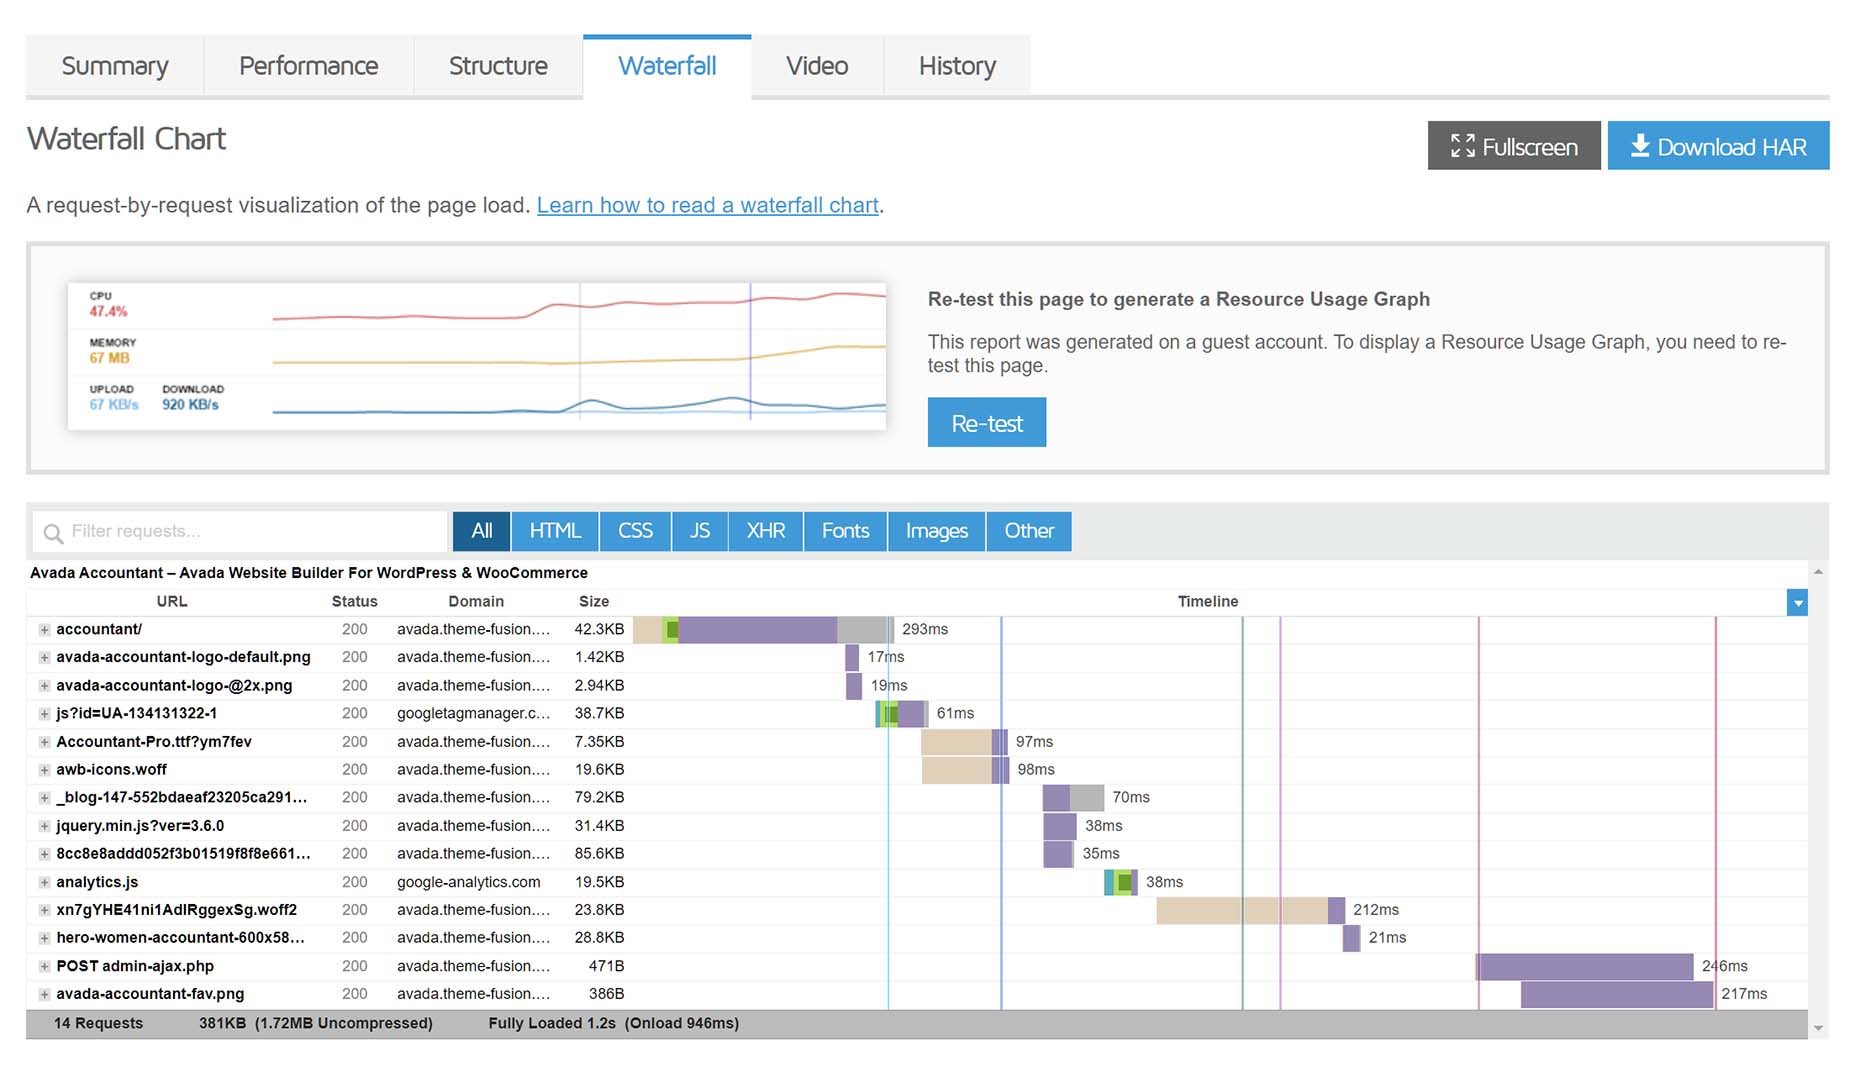
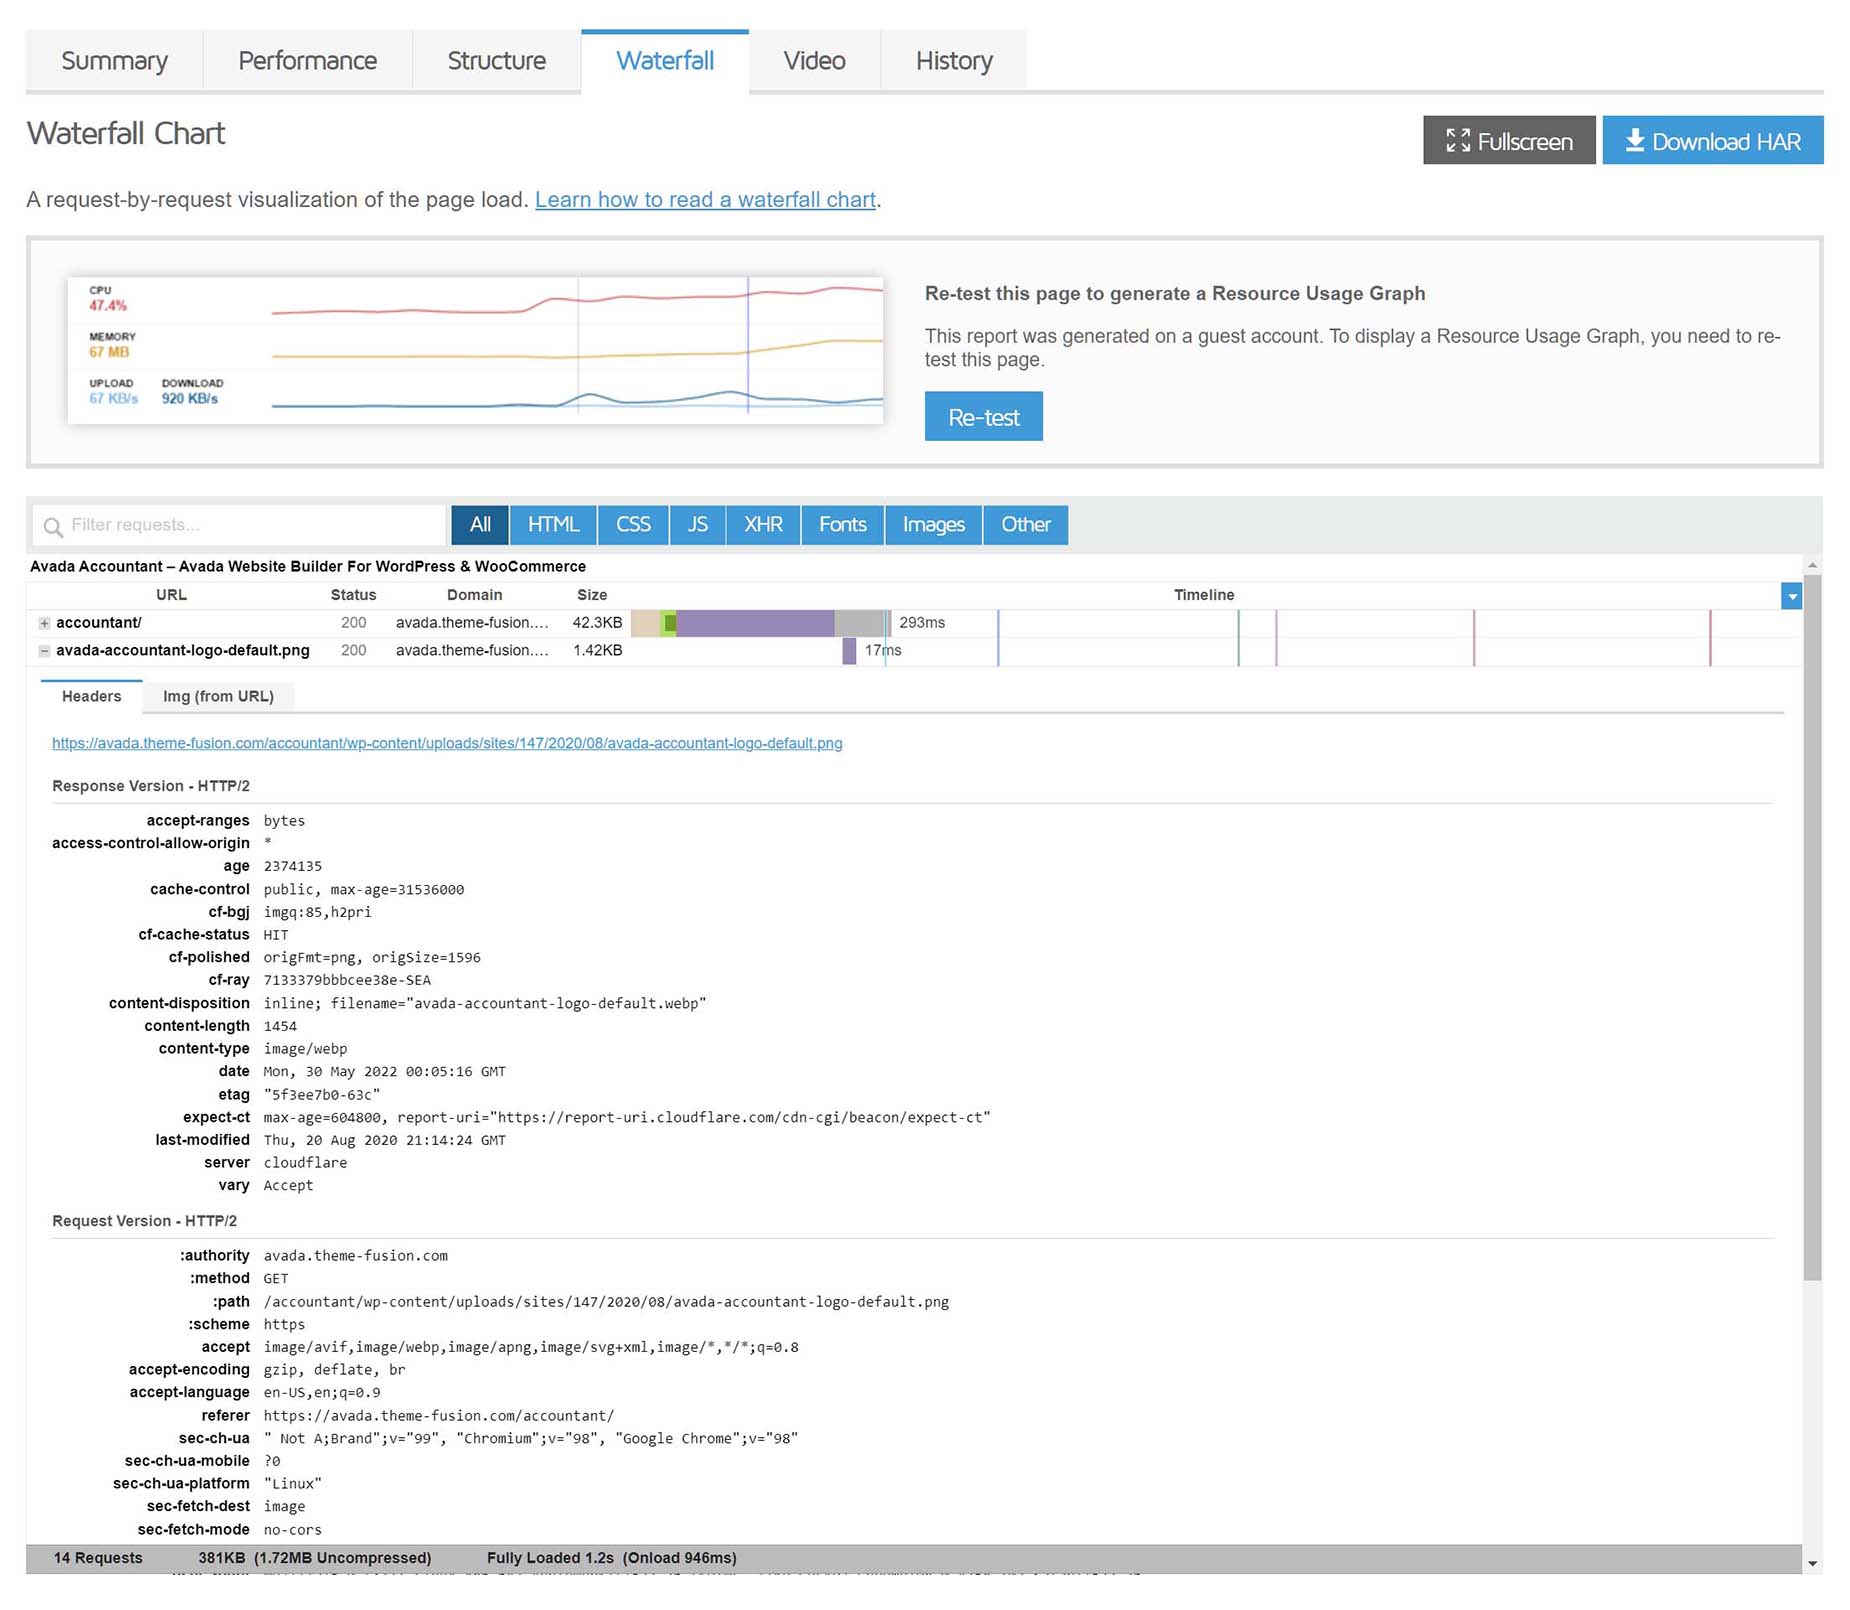
Like the other tabs, you can drill down into the specific load events shown in the Waterfall chart for more information, by clicking on the small plus button at the far left.
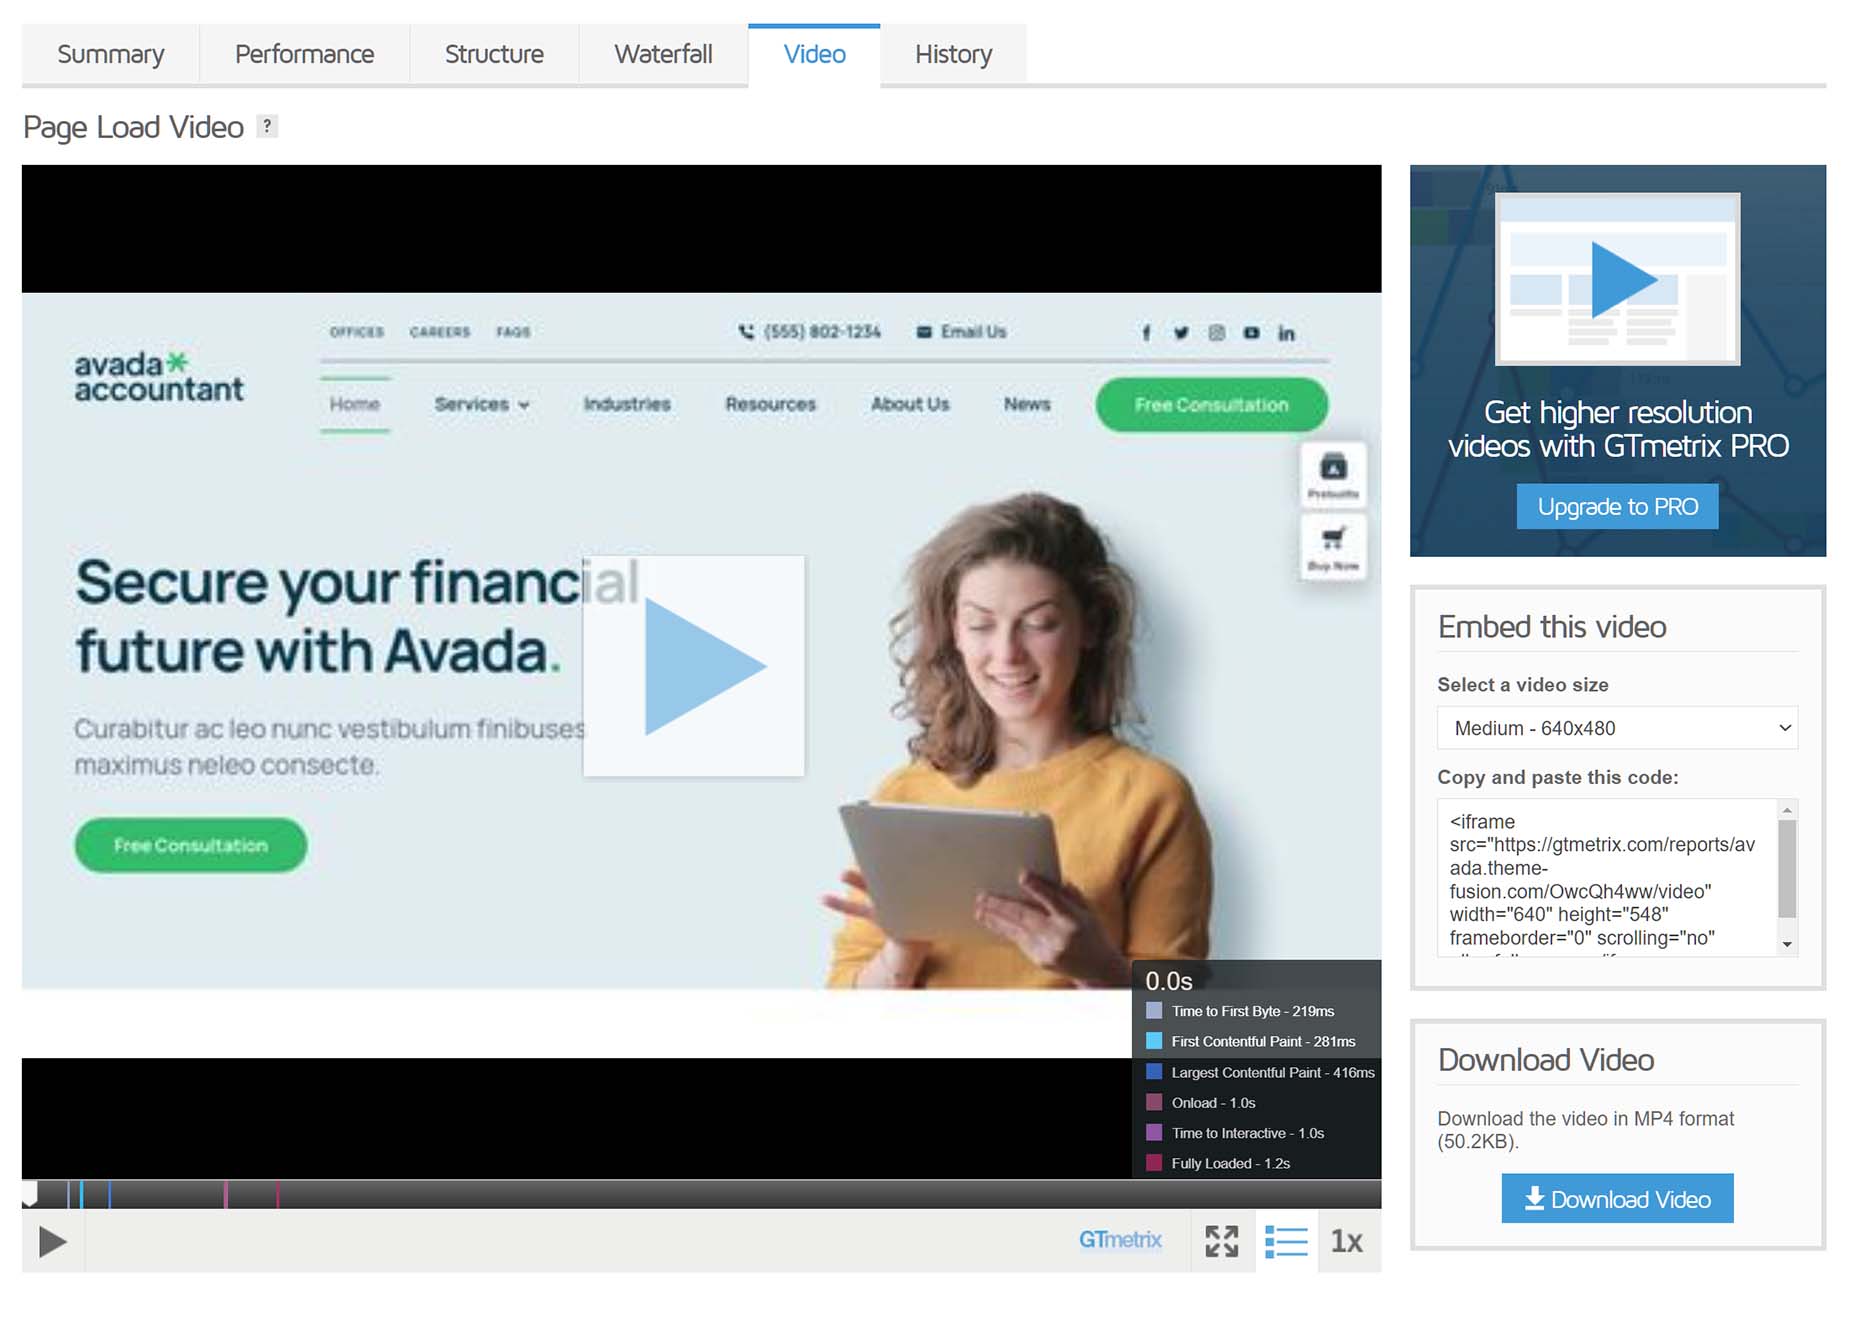
Video
It’s also possible in GTmetrix to record and playback a video of the page load, showing yet another visualization of the page load. You can change the speed down to a 1/4 speed to get a good idea of what’s loading when.
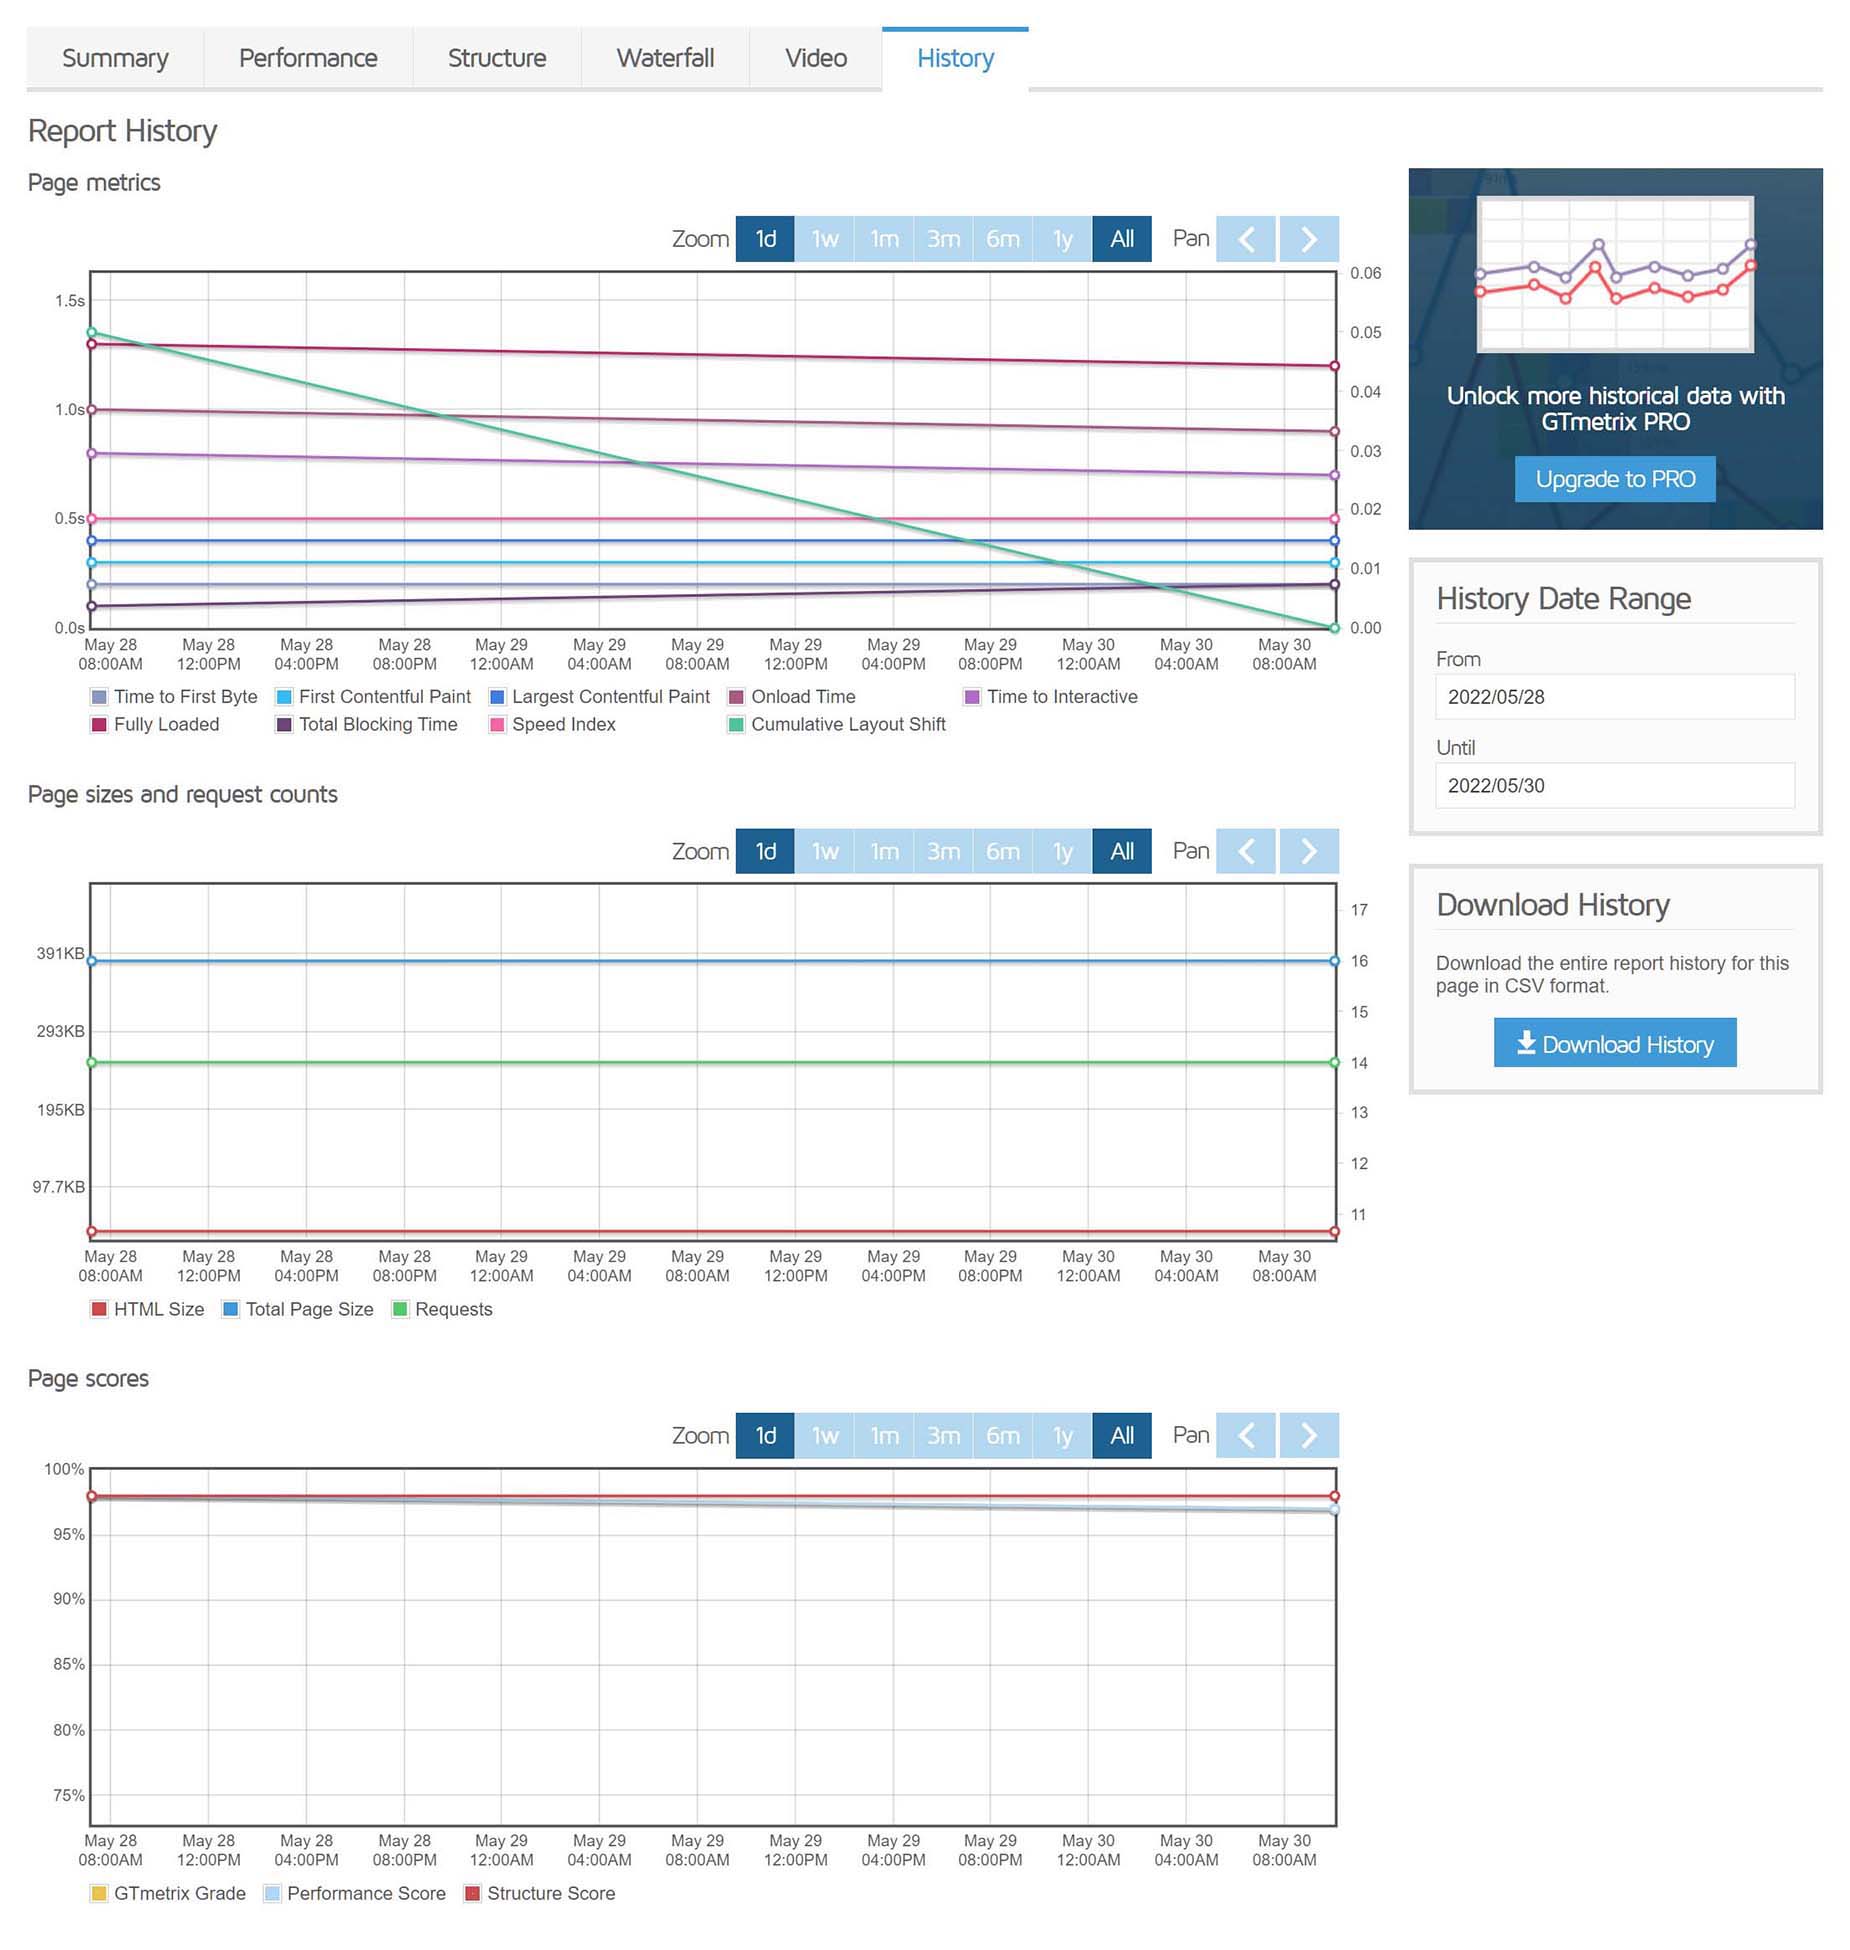
History
Finally, the history tab, shows you your history of tests with that specific url. Depending on how long you have been using it, there will be more or less data in here for you to analyze.
Conclusion
GTmetrix is a relatively easy tool to use, and very valuable to help detect and remedy issues that may be affecting your website’s load time. Much of it is very technical however, and it does however require time, patience and expertise to learn.
Remember, due to hosting and content variables, website optimization is a very complex, technical area, and falls well outside of the support we can provide for Avada.
Apart from our many documentation resources, the Facebook Avada User’s Group has a large and very active membership, and this topic is regularly discussed on the Group.