Performance Testing using WebPageTest
Last Update: November 3, 2025
We all want our websites to load quickly, and there are a number of services out there to help us test, evaluate, and fix various issues affecting the loading speed of our pages. In this series of docs, we will be looking at the major players in this area, Google PageSpeed Insights, GTMetrix, Pingdom and WebPageTest, and how they can help you improve the loading speed of your Avada website. Read on!
WebPageTest
WebPageTest is a website performance testing site, targeted mainly towards developers. It offers a plethora of website performance testing options, in a freshly revamped interface. Of all the major testing platforms, this one is often considered the best, due to it’s enormous number of options. Let’s dig into the options on offer with this awesome tool.
Options
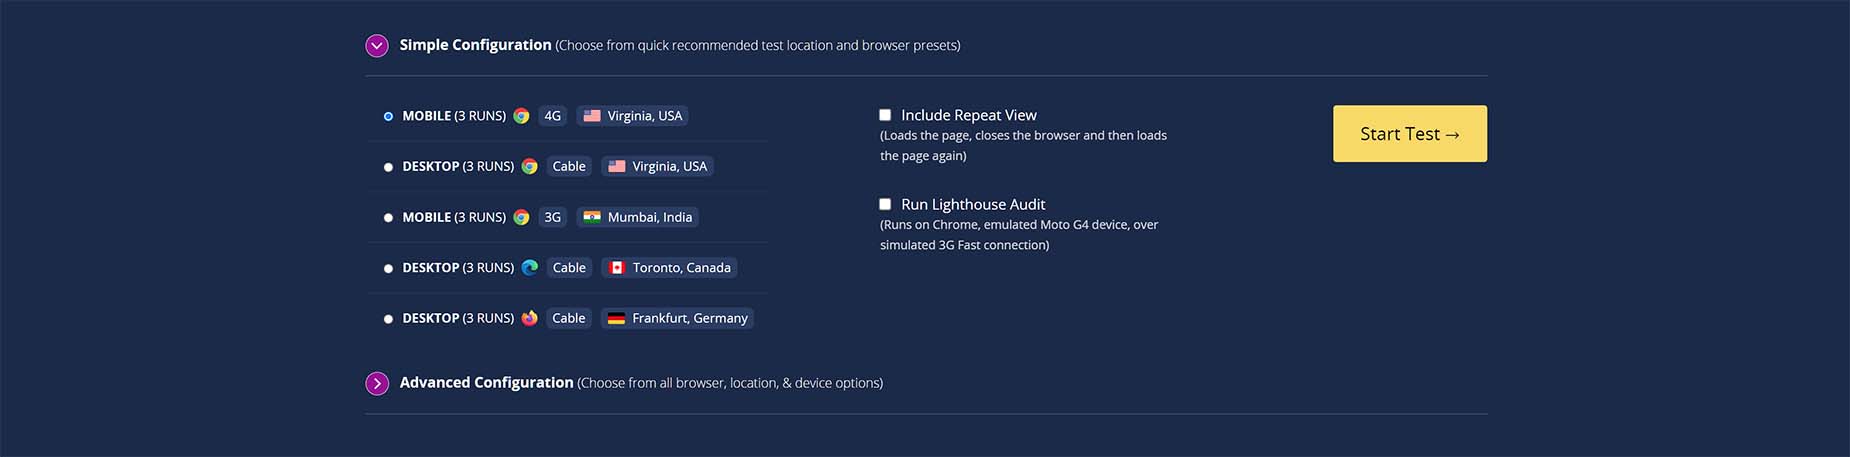
Simple Configuration
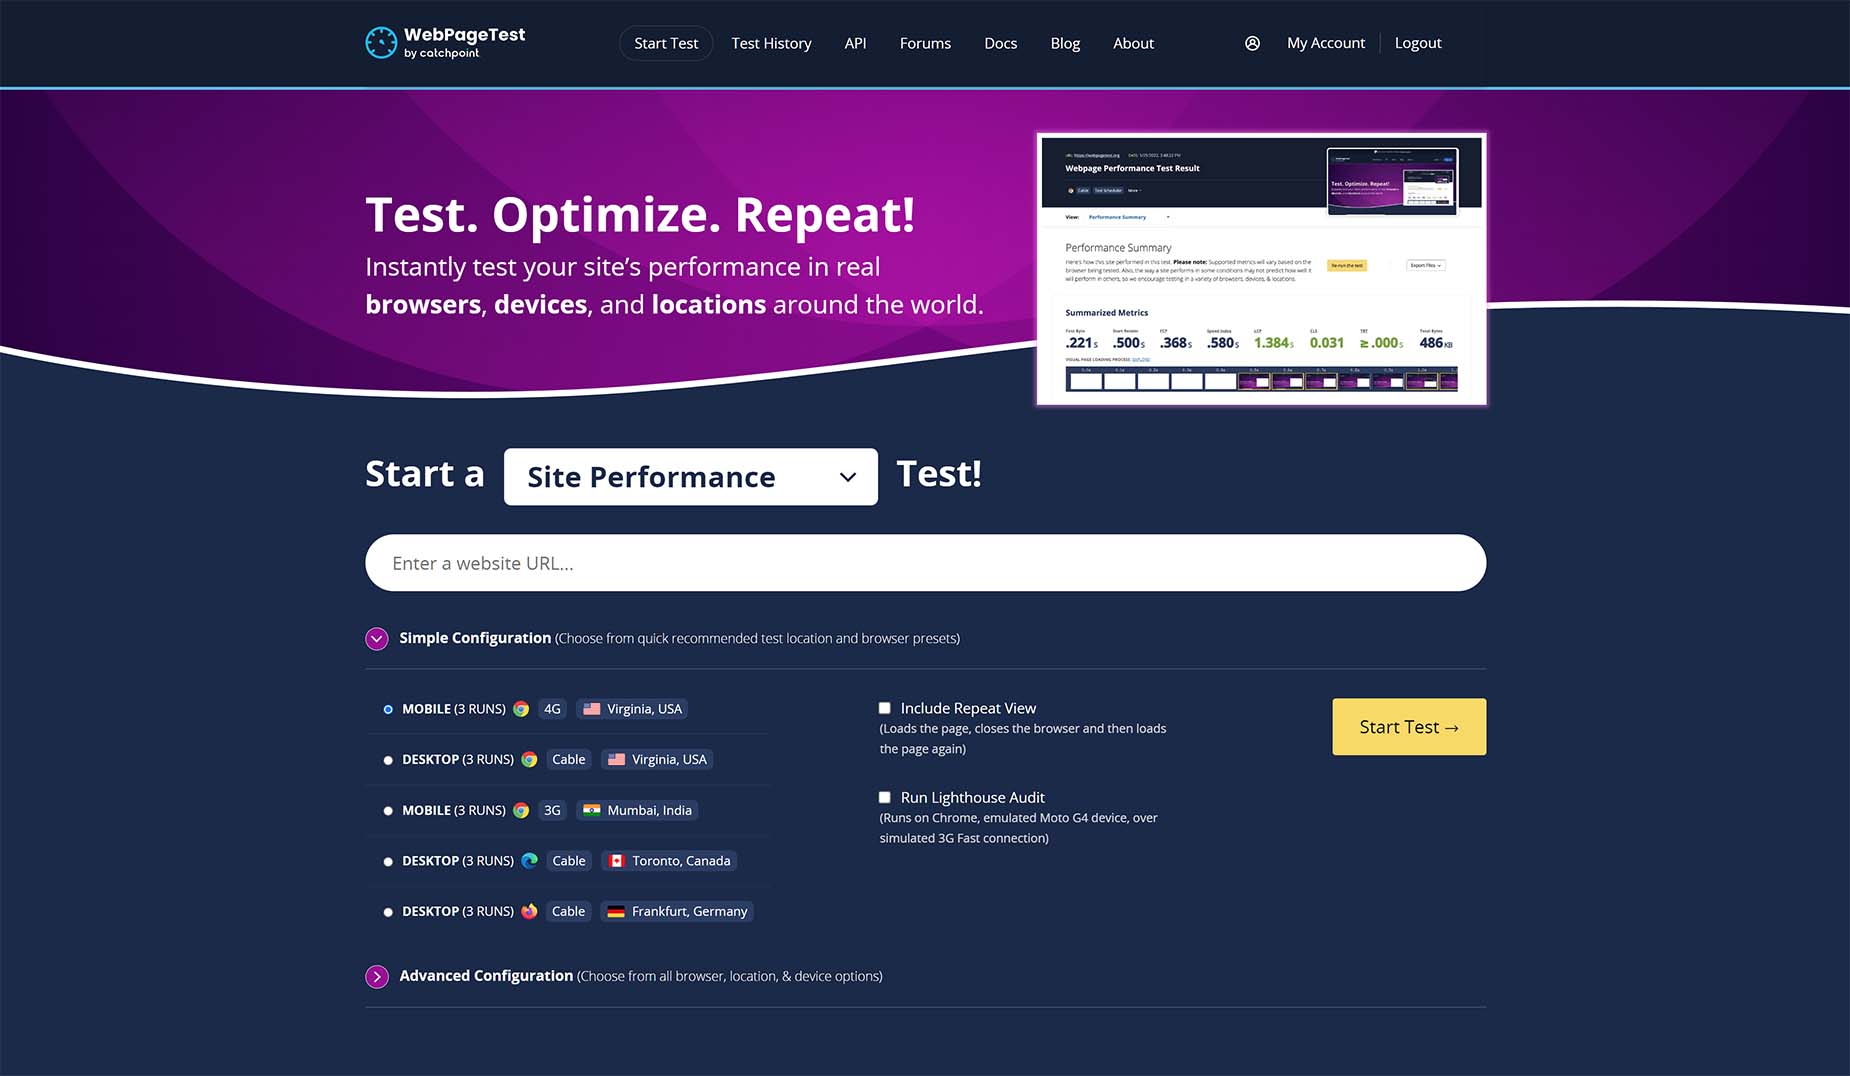
The Simple Configuration interface is correspondingly simple. You can choose whether to use a Desktop or Mobile configuration, using 3G, 4G, or Cable. By default, the site chooses a 4G Mobile configuration, testing from Virginia, USA. You can also include a repeat view of the site, and run a Lighthouse audit, but that’s where your options stop. For a simple test though, this is still a great starting point.
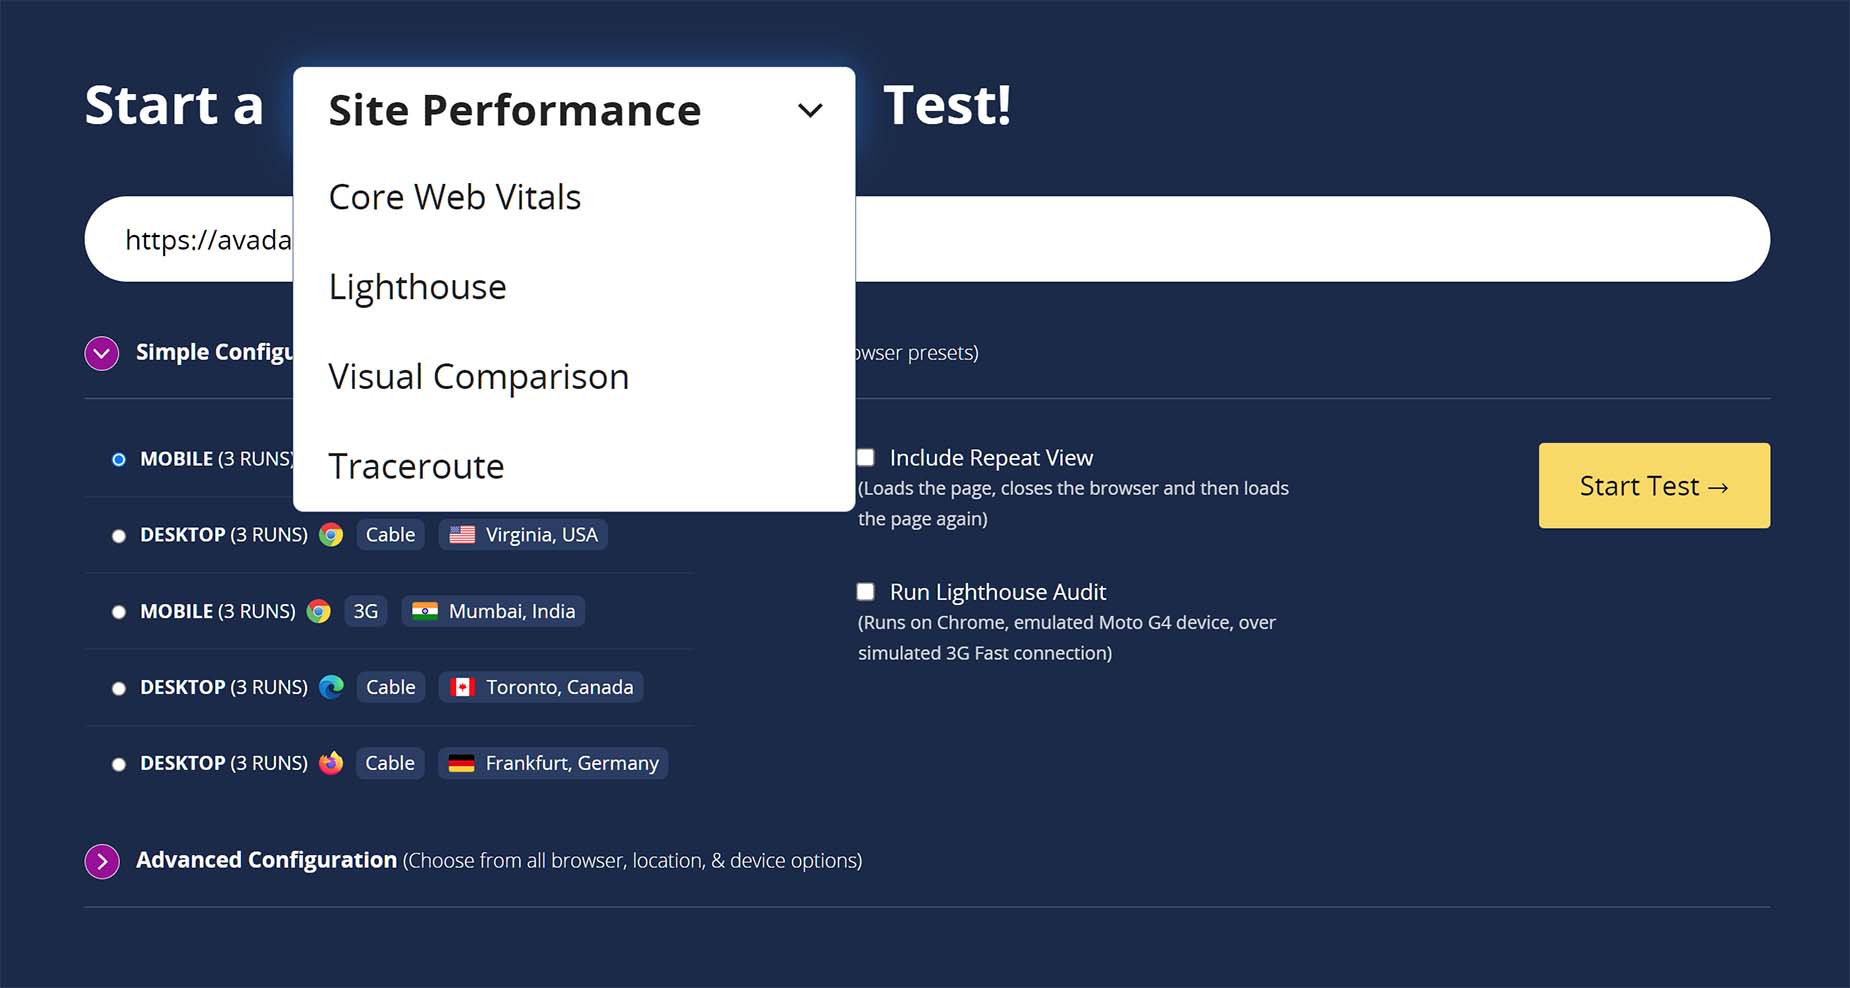
And not only can you run a Site Performace Test, you can also choose just to run one of the other tests WebPageTest offers, like Core Web Vitals, Lighthouse, Visual Comparison or Traceroute. By default, it runs a Site Performace test which includes the Core Web Vitals anyway.
Advanced Configuration
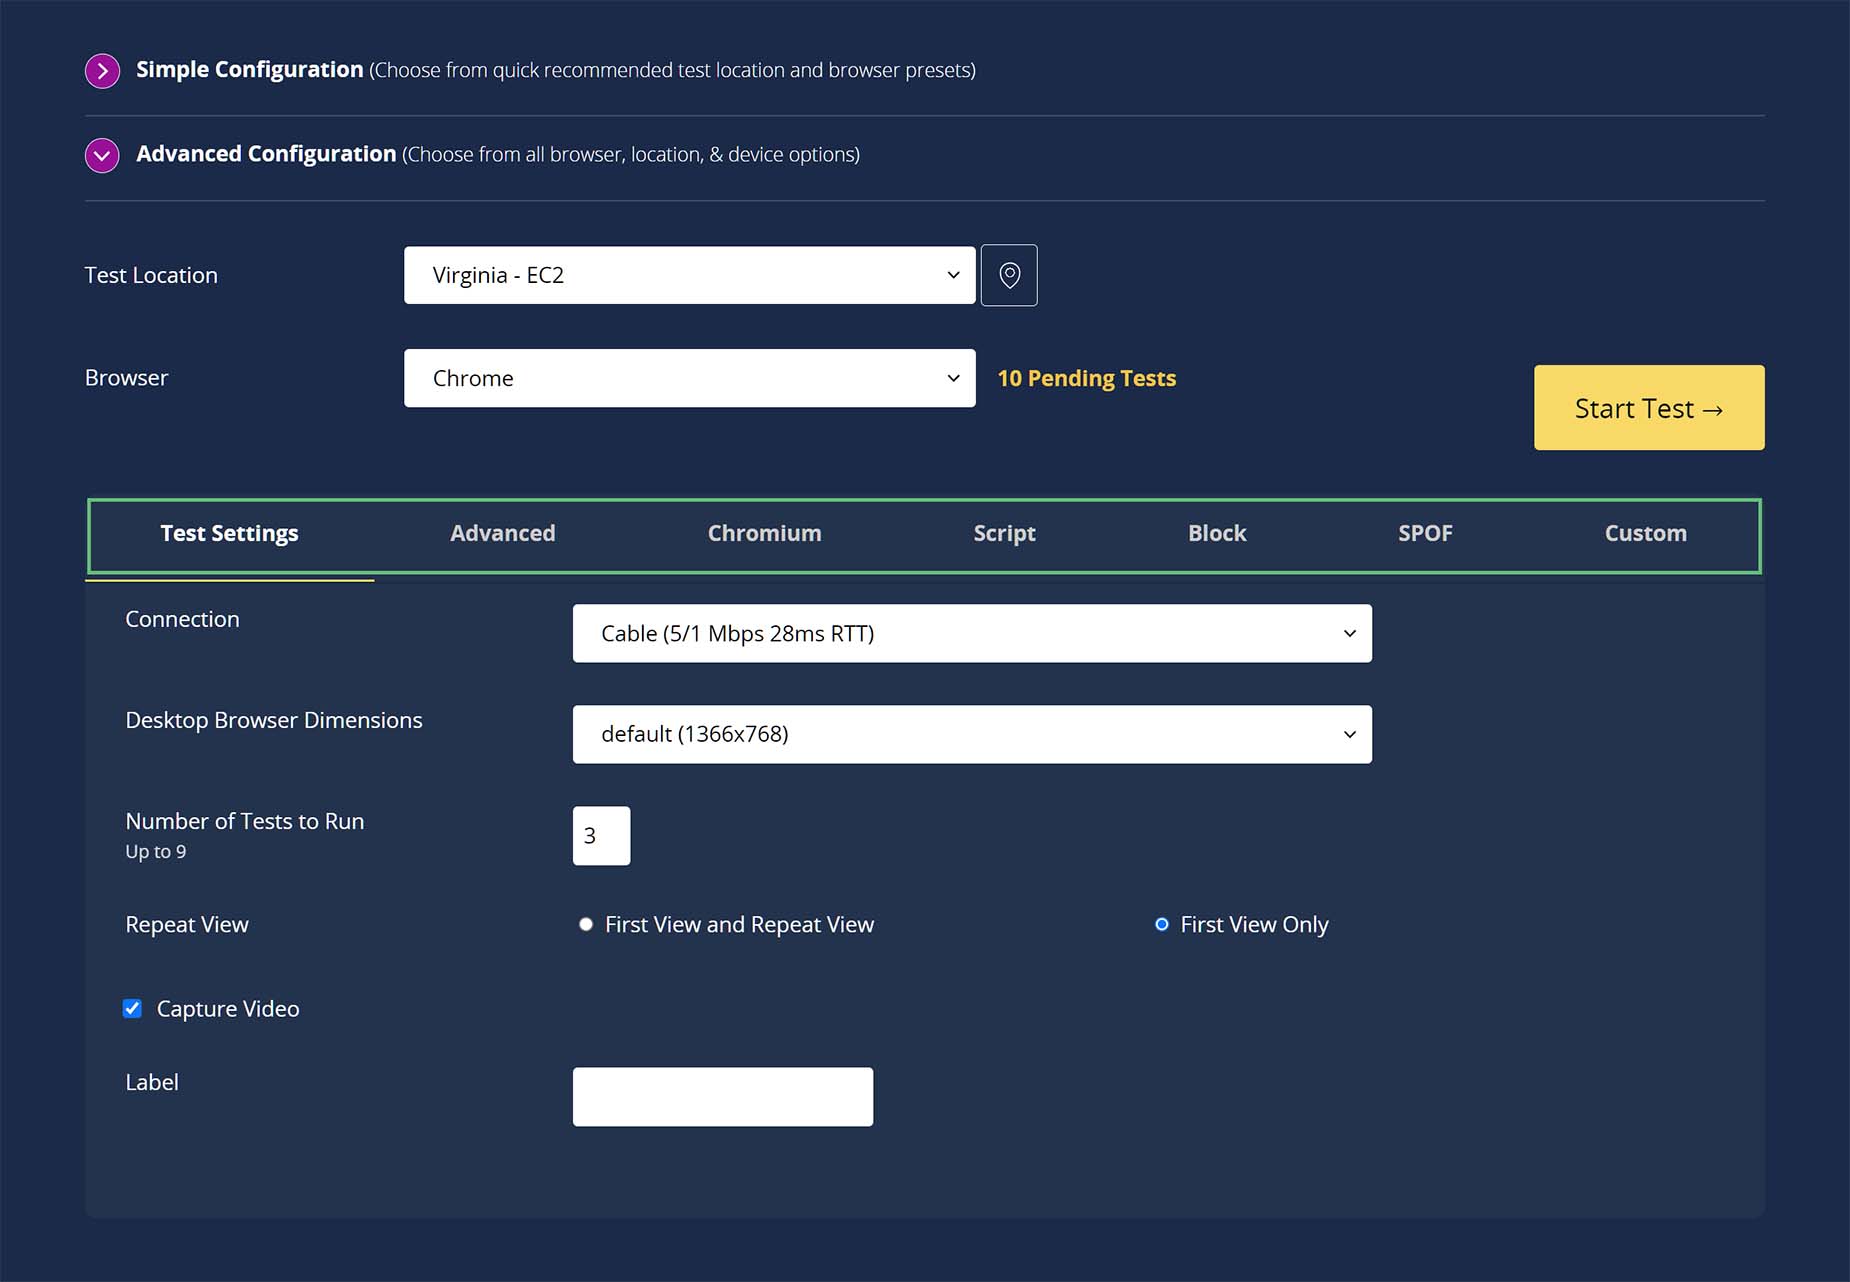
There are simply too many options in the Advanced Testing section to cover, as this is designed to be a powerful tool for developers. But there are choices here not available in the Simple Testing section that can be very useful, even to beginners.
To start with, there are a huge number of Test Locations to choose from, and in the default location, also a huge variety of devices to use. Virginia is the default location, and with that location, you can choose from a large number of browsers and browser dimensions, which to run your test. If you prefer, you can even select your testing location from a map.
The diversity of testing options on offer make this a very powerful tool for developers. There is the ability to run up to 9 consecutive tests, and you can show results for the first view only or also the repeat views, and you can capturing video of the page load as well. Going into the other tabs would only be useful for developers, but there are a huge range of options to customize your tests as much as you want.
Performance Summary
When the test has completed, you are presented with a Performance Summary. This shows your results in all the Observed Metrics, from First Byte though to Total Blocking Time and Total Bytes, as well as Real User Measurments like First Contentful Paint, and Time to First Byte.
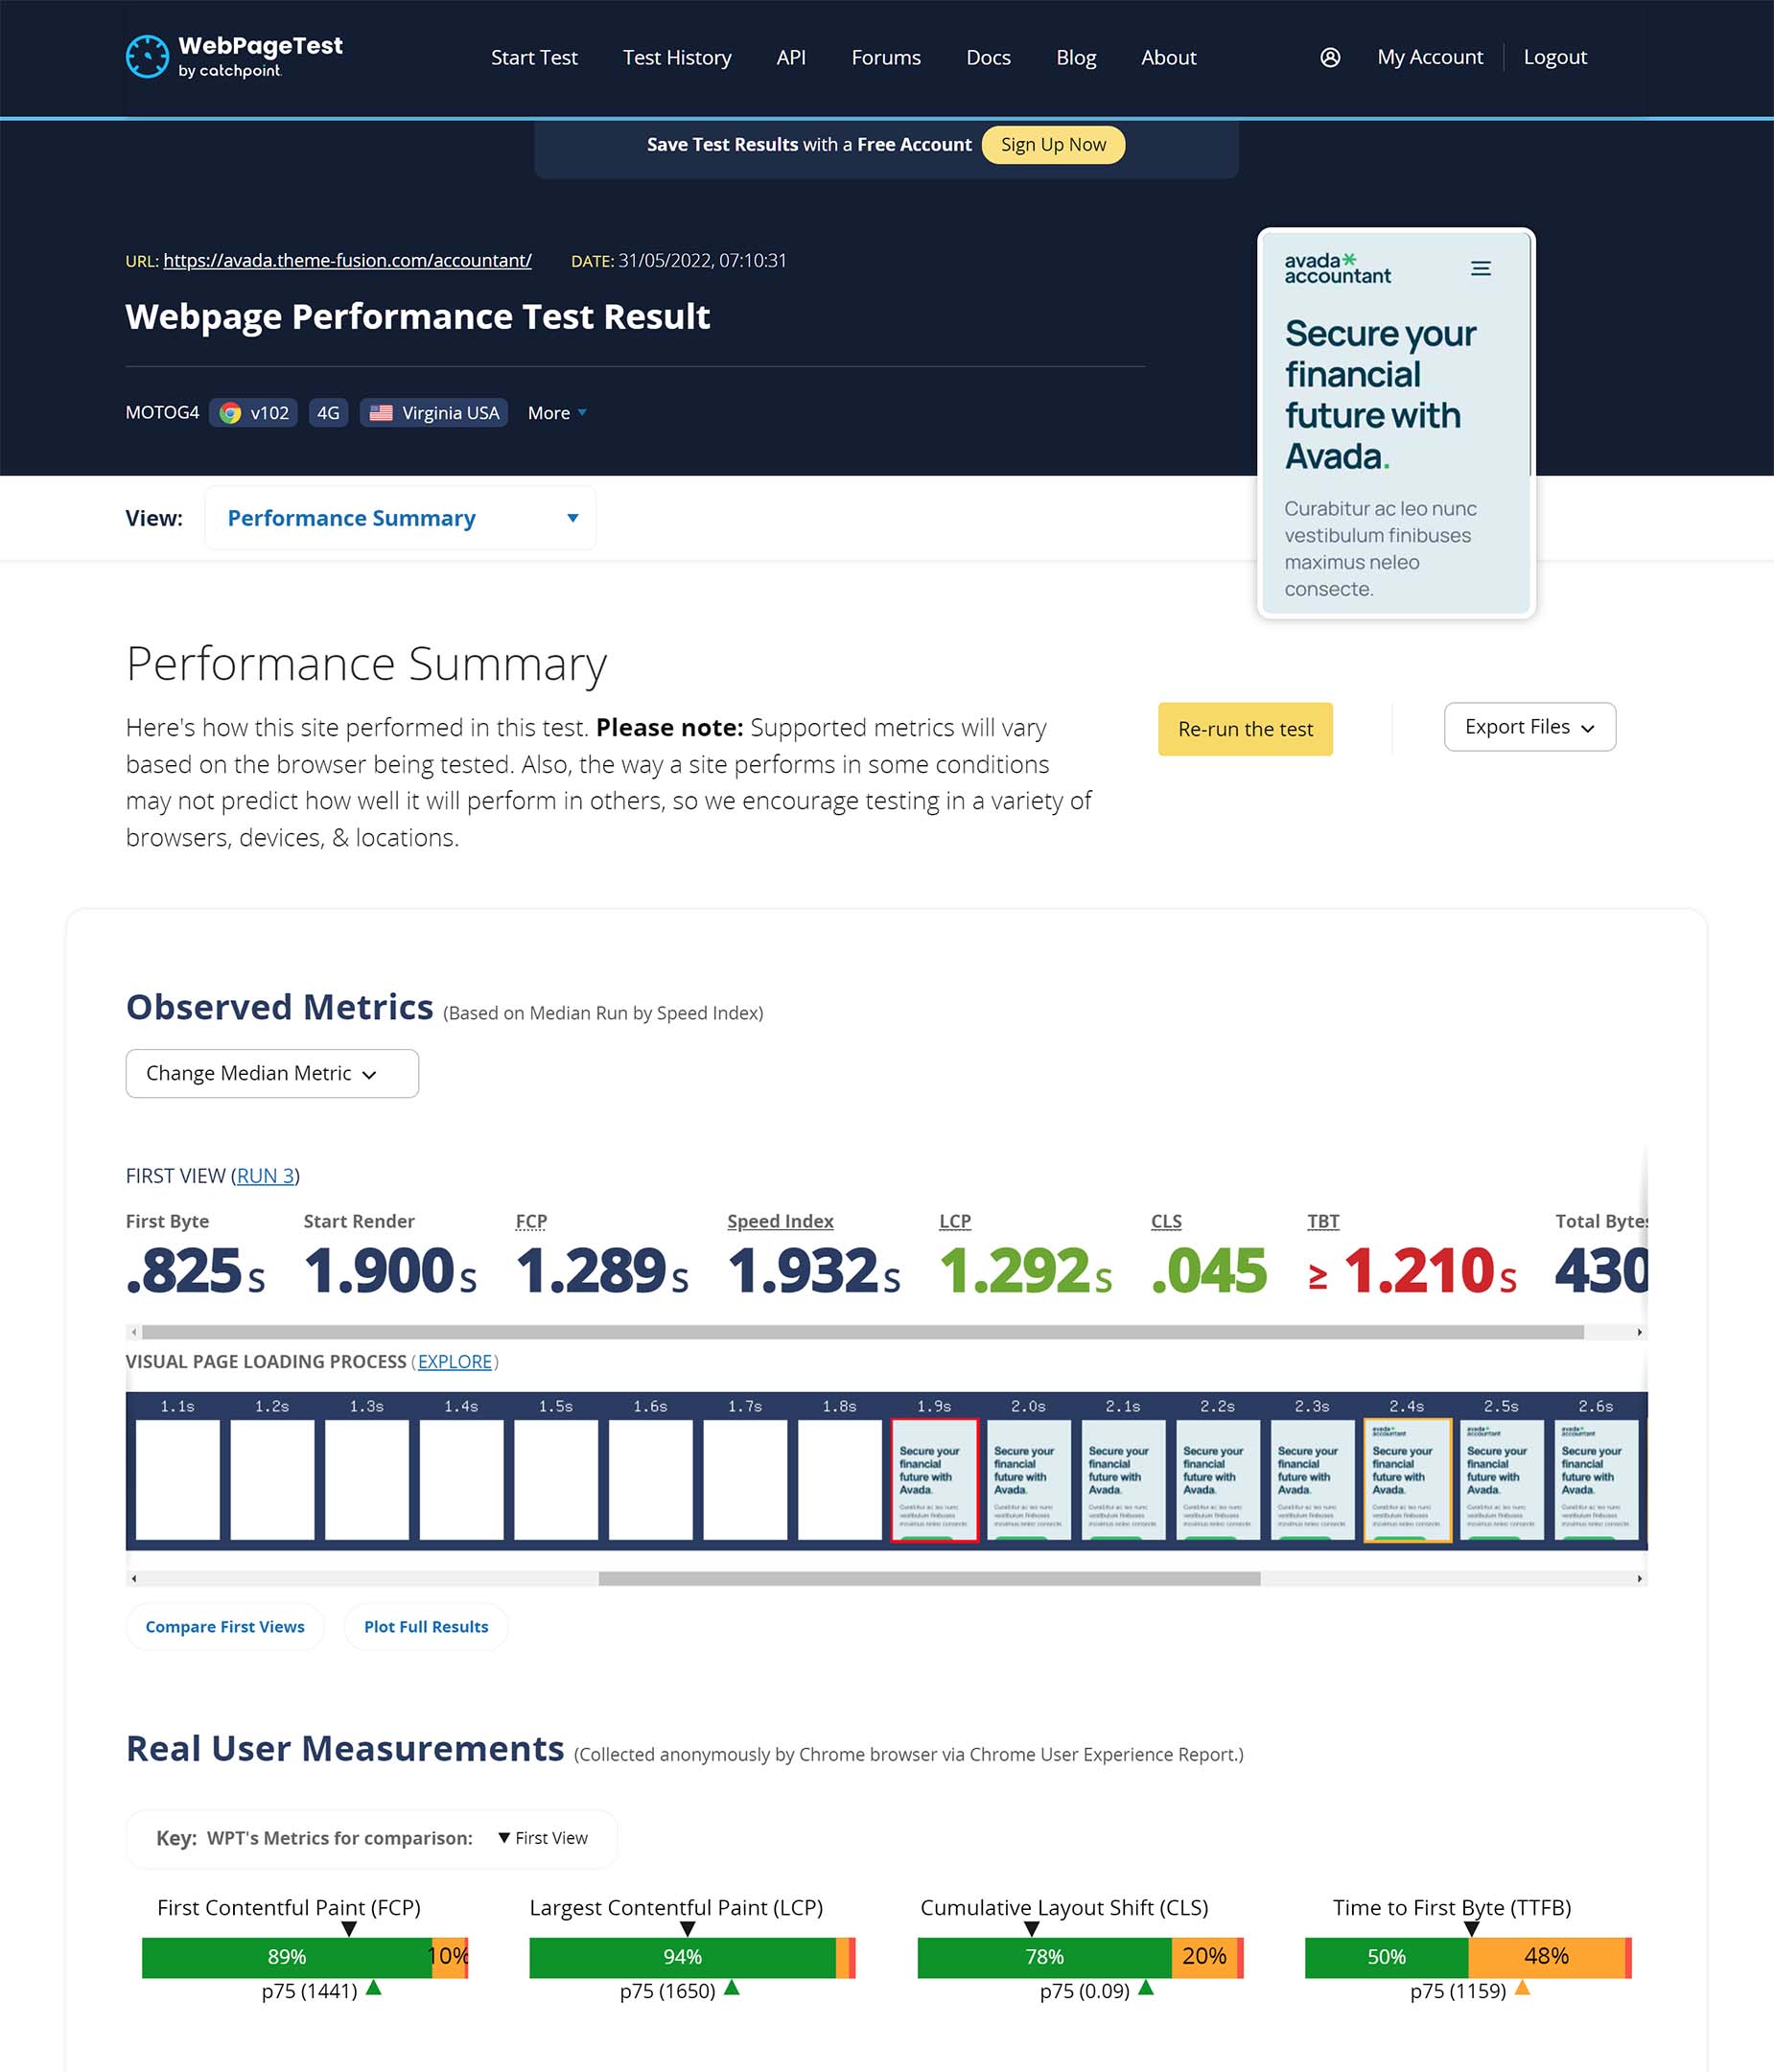
At the top of the page content, there is a dropdown menu with the links to the other result tabs. We will cover them one at a time. There is also an option to Re-run the test, and an Export Files link to download the data in various formats.
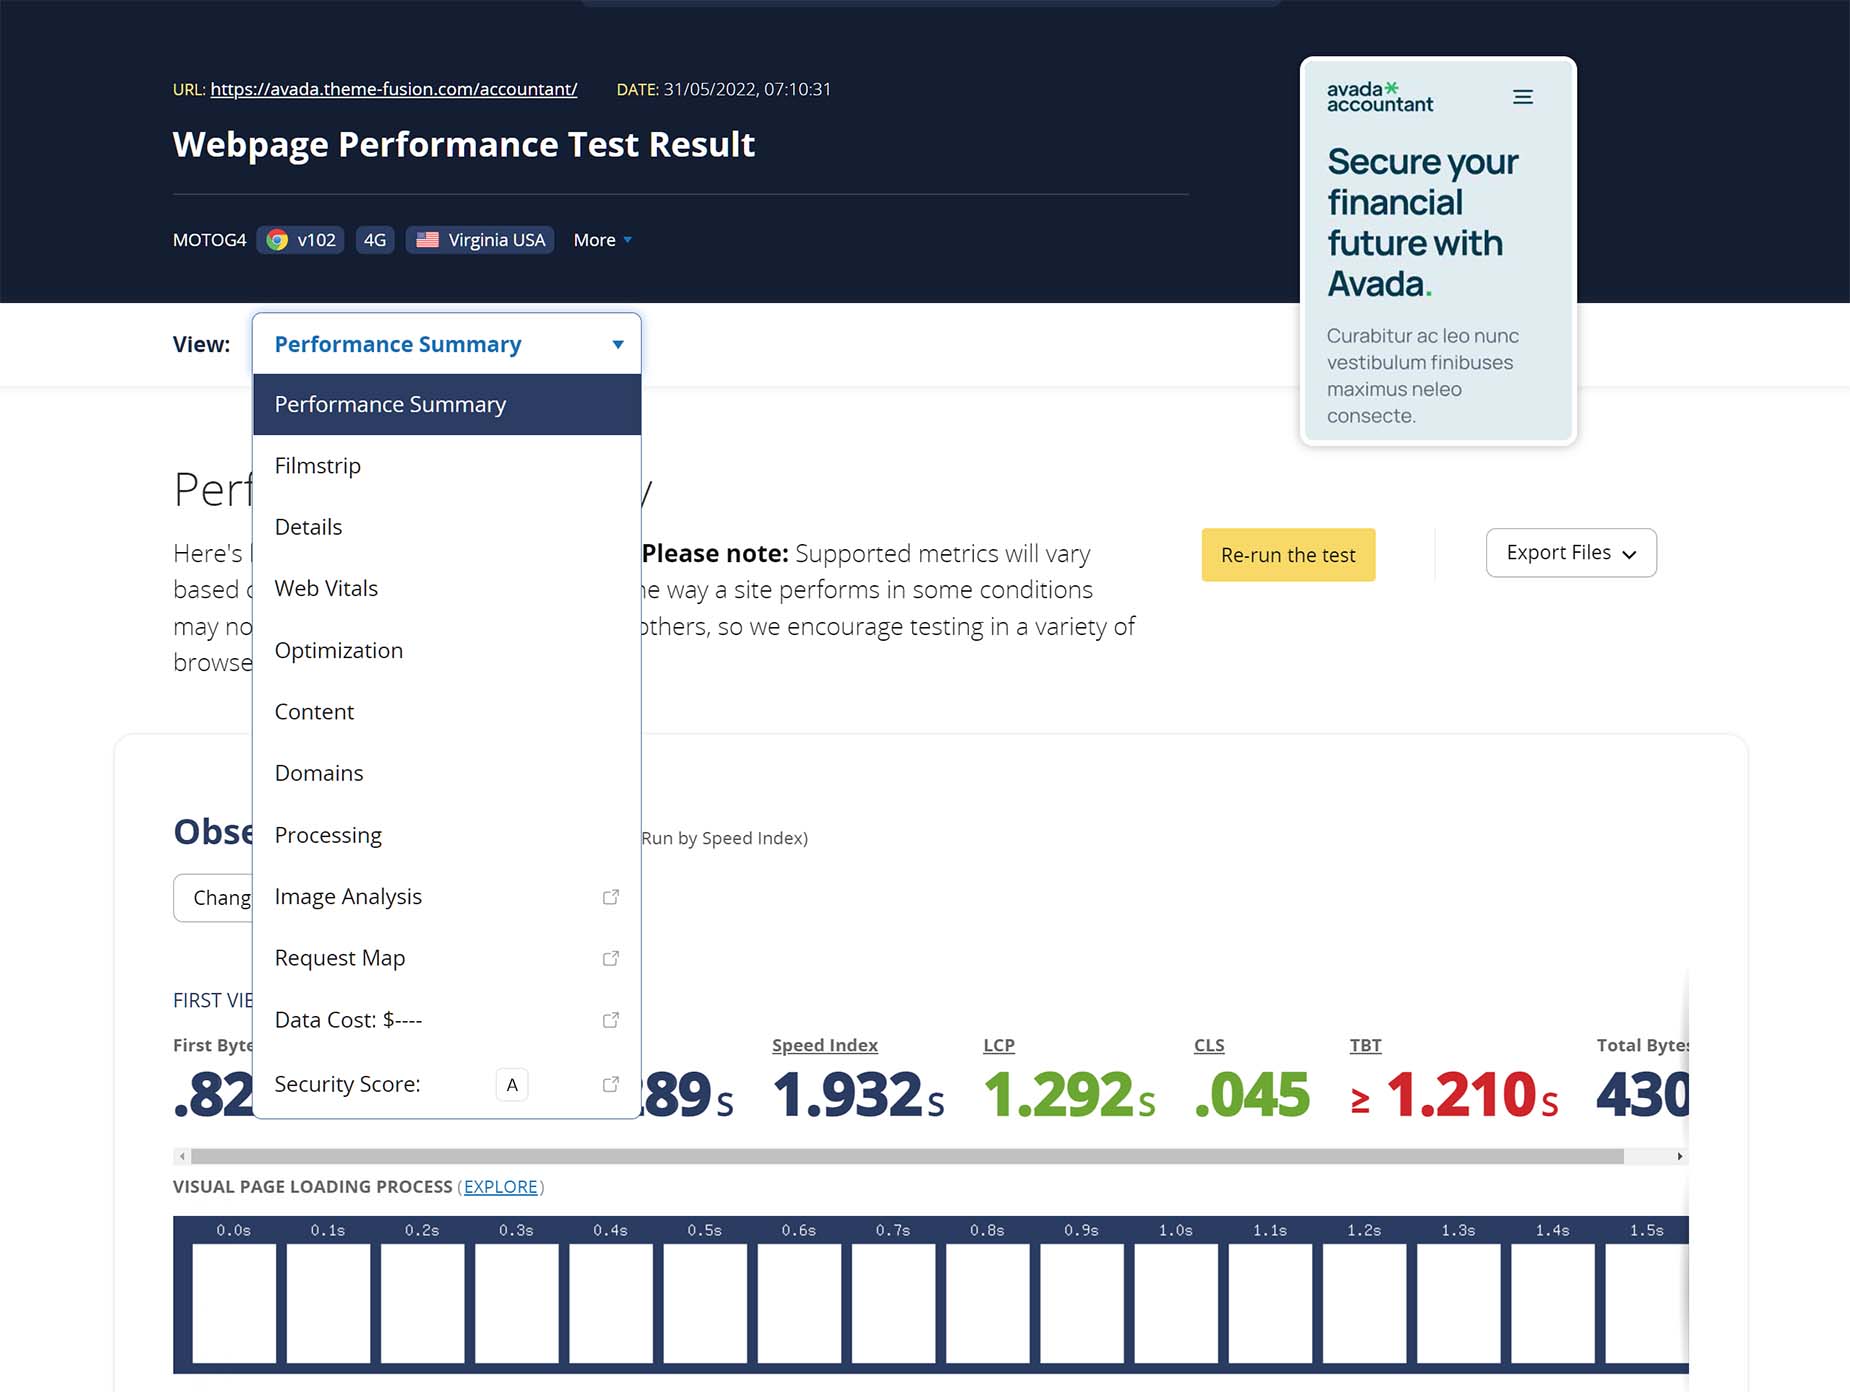
Let’s now look at the individual results tabs and what they can show us.
Filmstrip
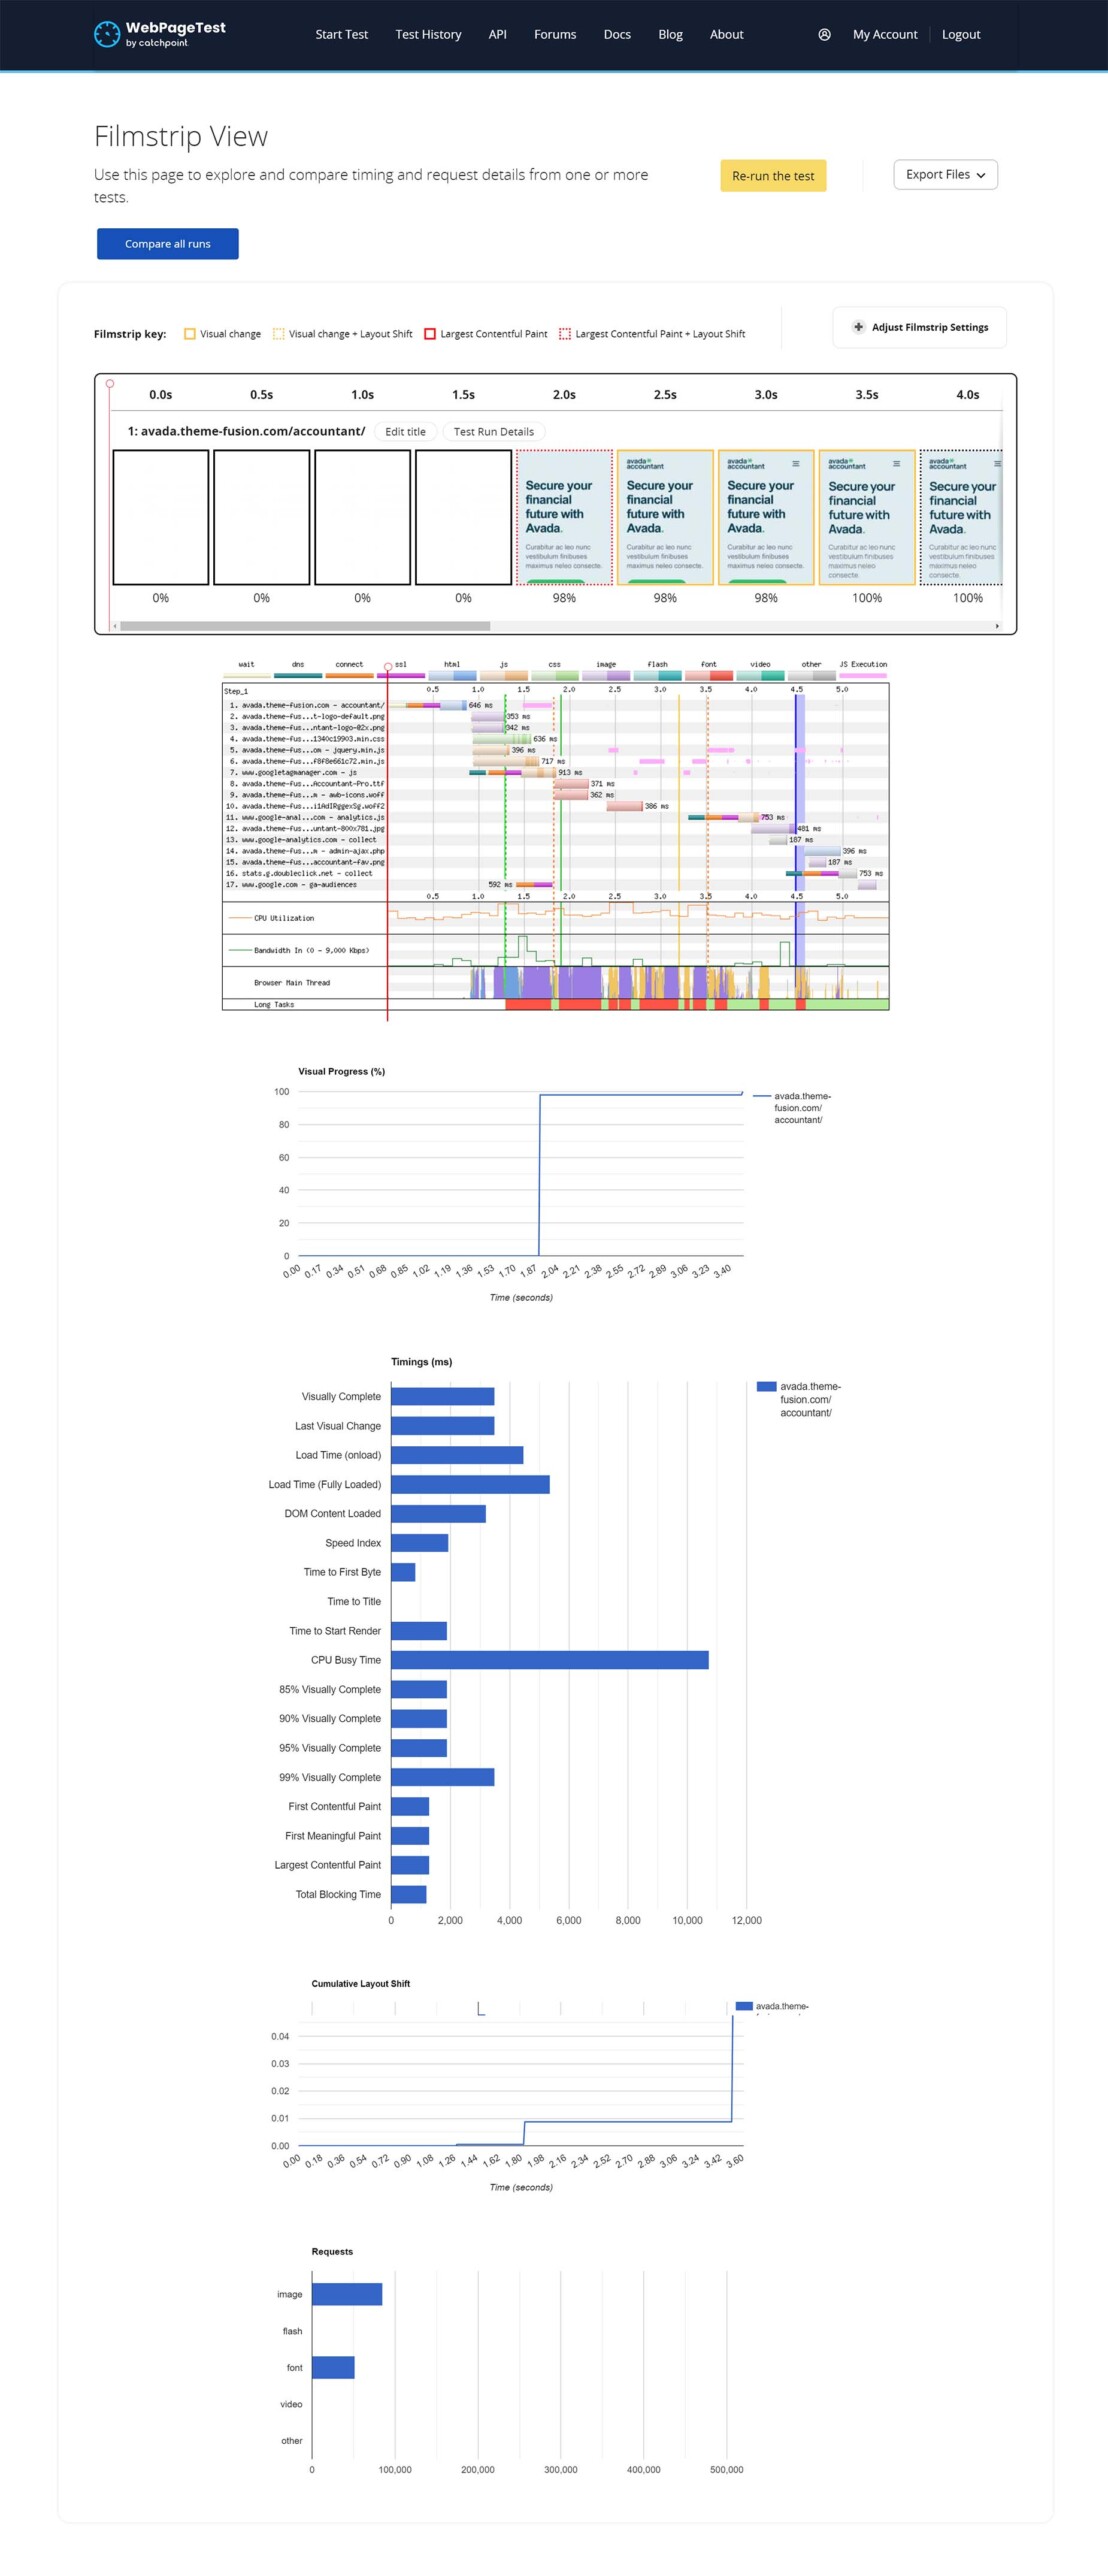
The Filmstrip tab offers a filmstrip of the load time of the site. There is a key to understand the individual frames of the filmstrip and you can adjust the Filmstrip Settings.
As you scroll though the filmstrip, a red marker shows you the relevant place in a waterfall diagram. Under this is a chart mapping the visual progress of the site as it loads, and below this are a range of charts showing the Timings, Layout Shifts, Requests and Bytes.
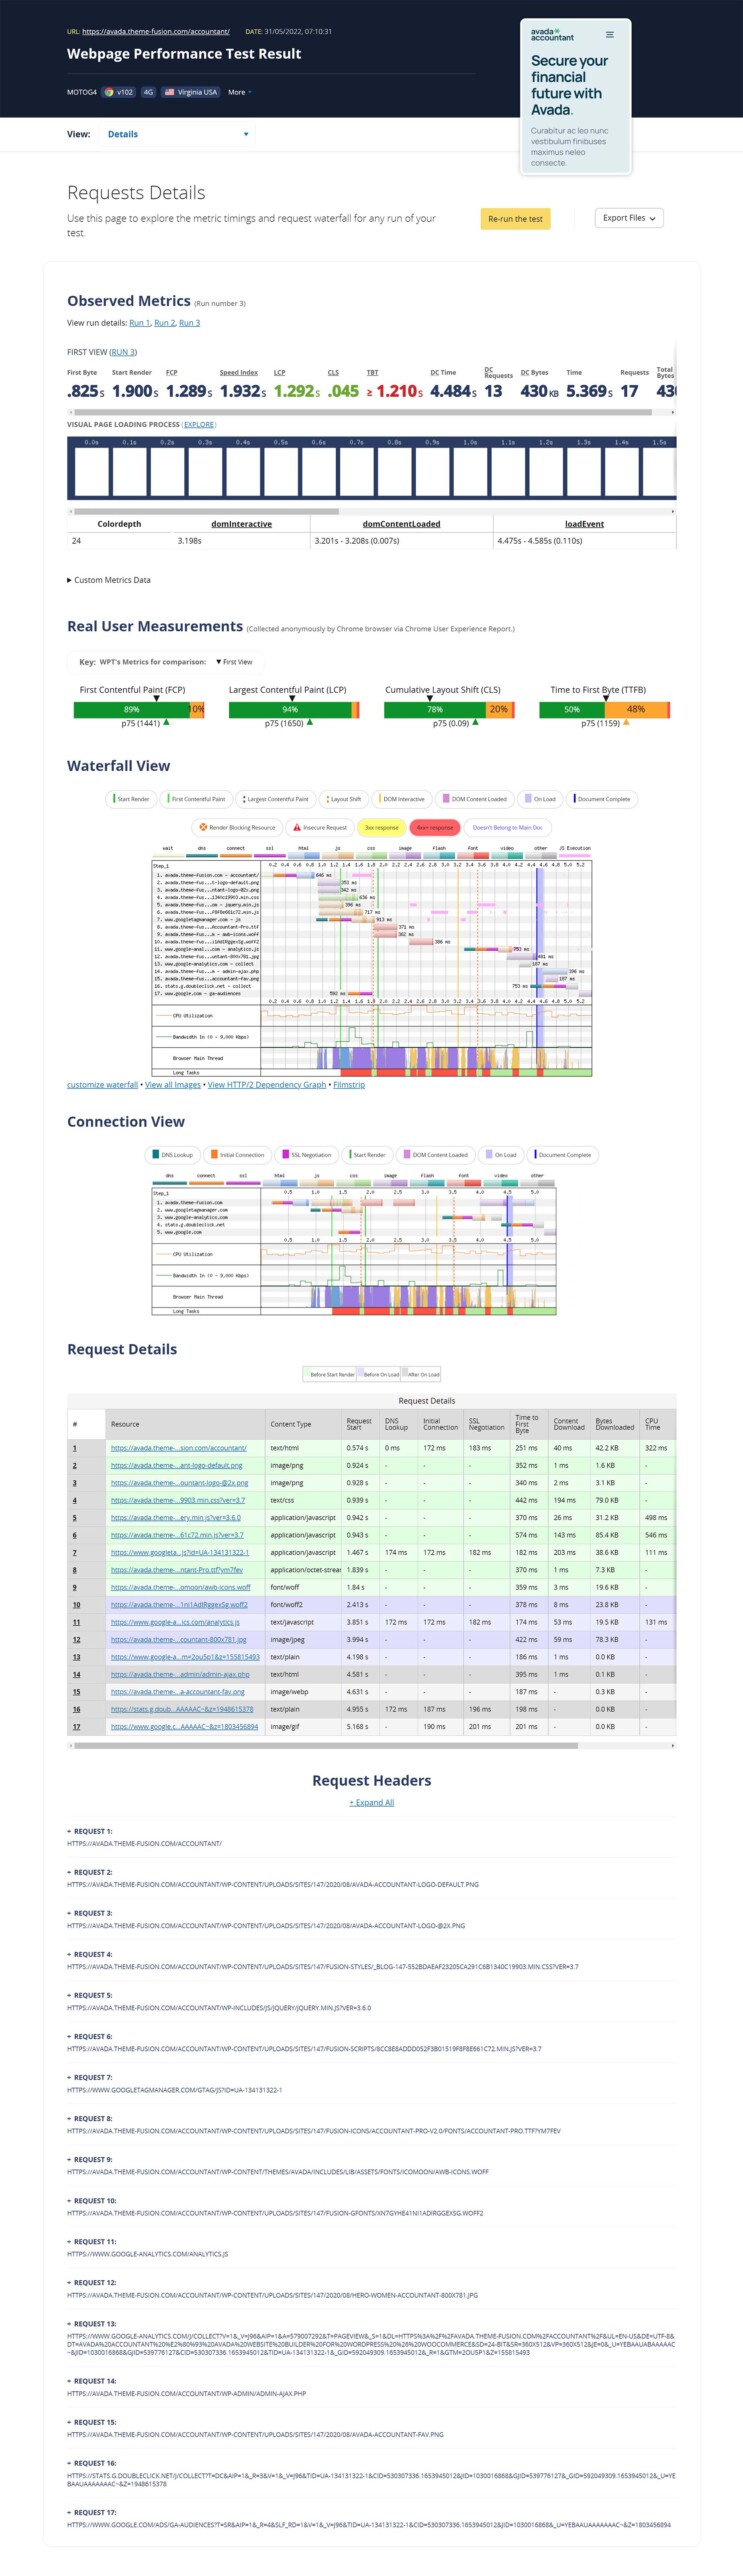
Details
The Details tab is where it gets very technical. As the descriptions says, you can use this page to explore the metric timings and request waterfall for any run of your test. The page is split up into 6 sections: Observed Metrics, Real User Measurements, Waterfall View, Connection View, Request Details, and Request Headers.
The Waterfall View, shows a cascading visualization of the page load across time, and you can click on any individual request to bring up more specific detail about that request. For a developer, you can see how powerful this can be.
The Request Details section provides details of every request, and if you click on the number of any particular one, you will be taken to the corresponding expanded entry in the Request Headers section.
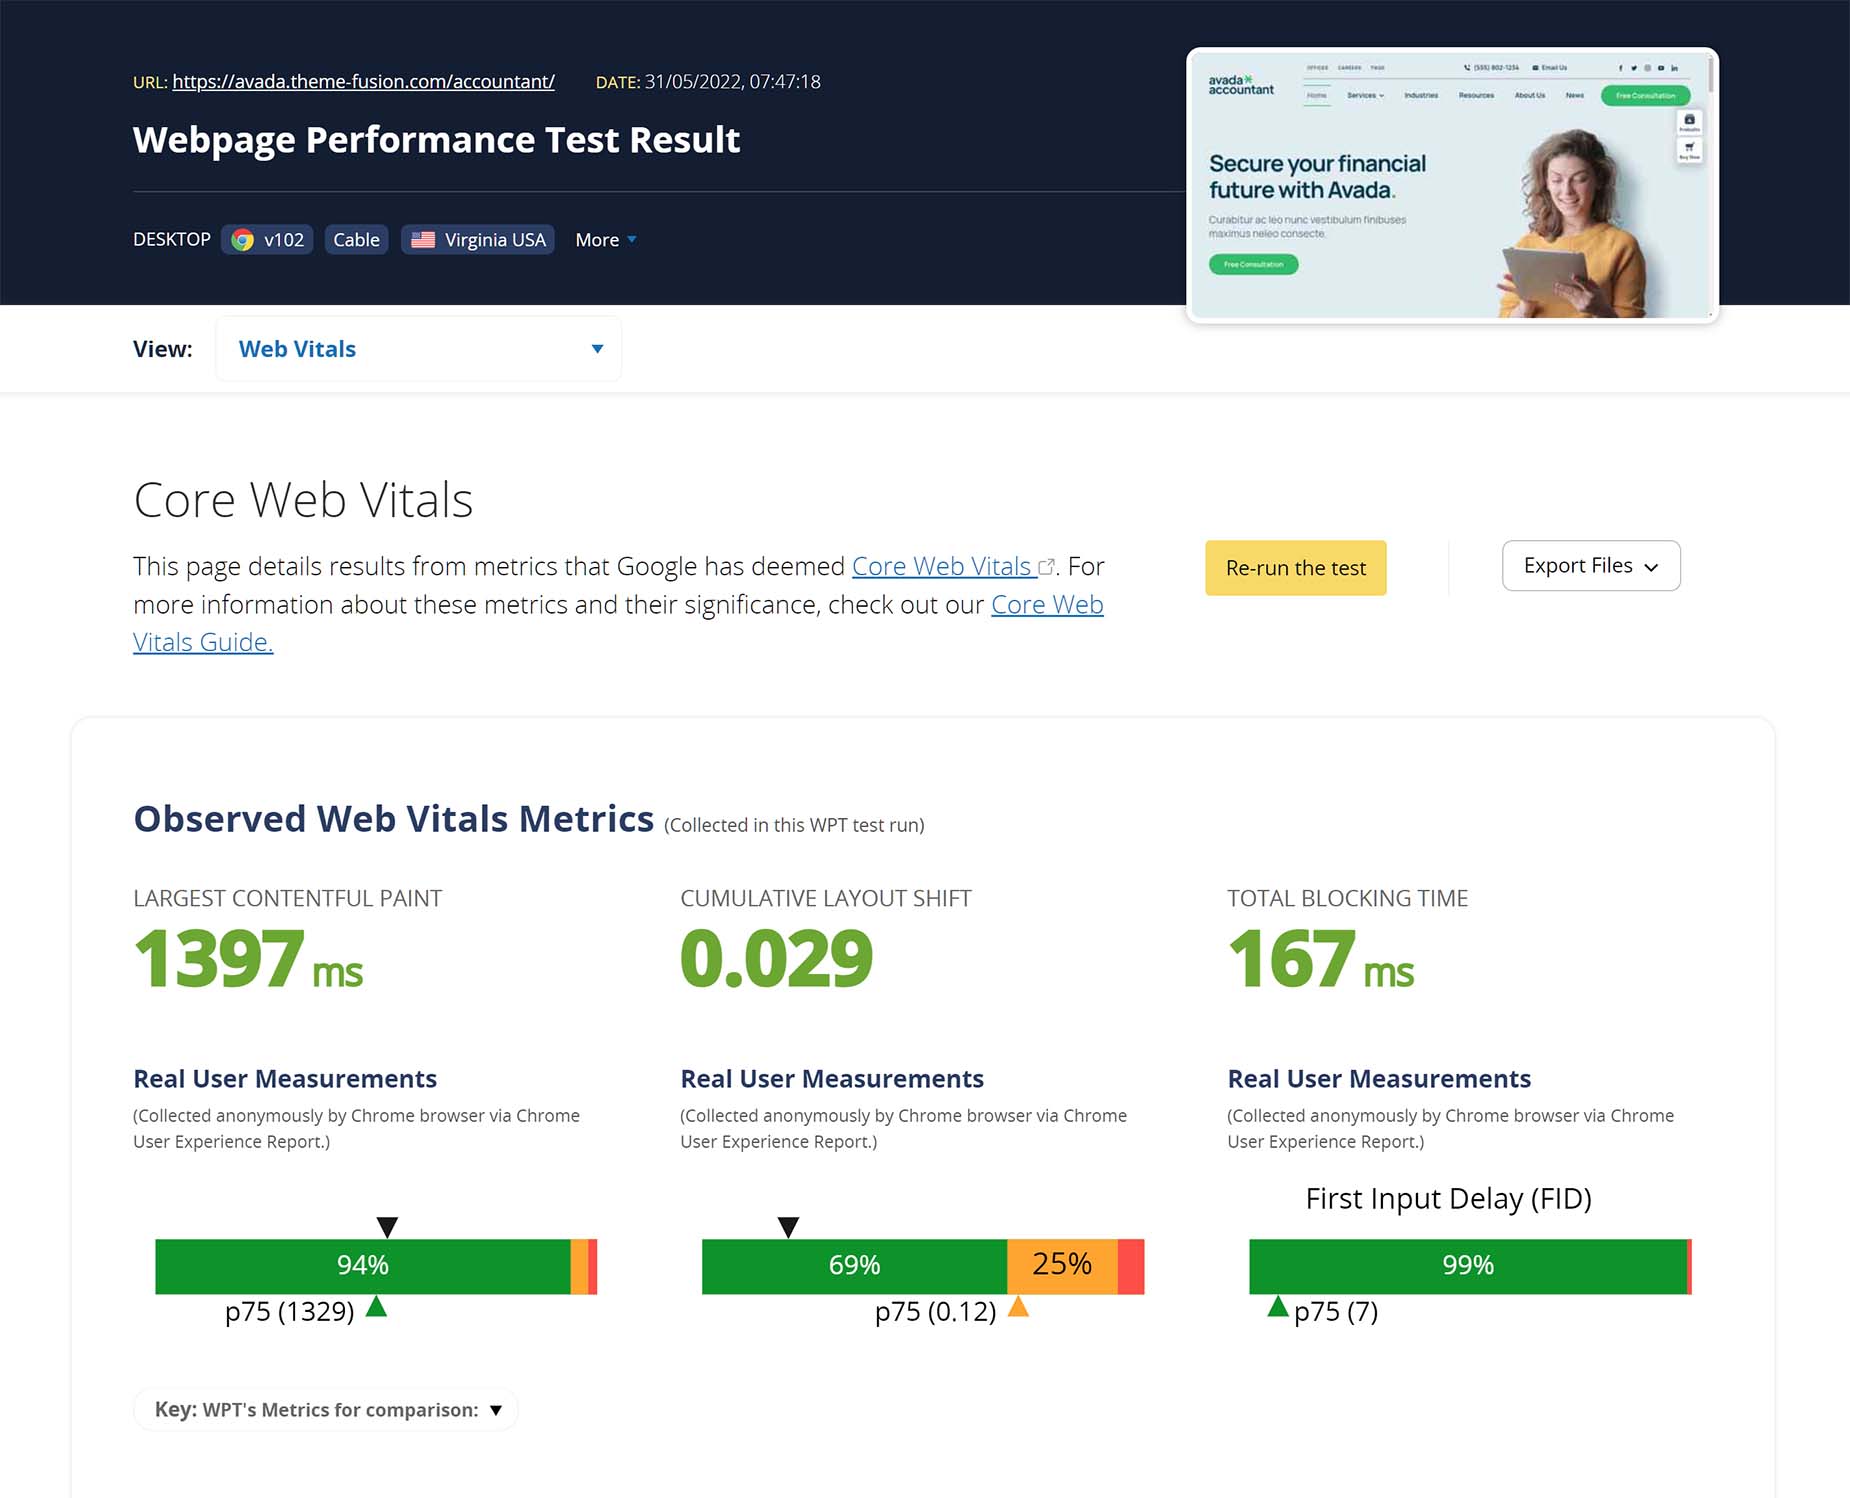
Web Vitals
The Web Vitals tab displays the results of the Core Web Vitals, a crucial bunch of metrics, developed by Google. You can read more about them here.
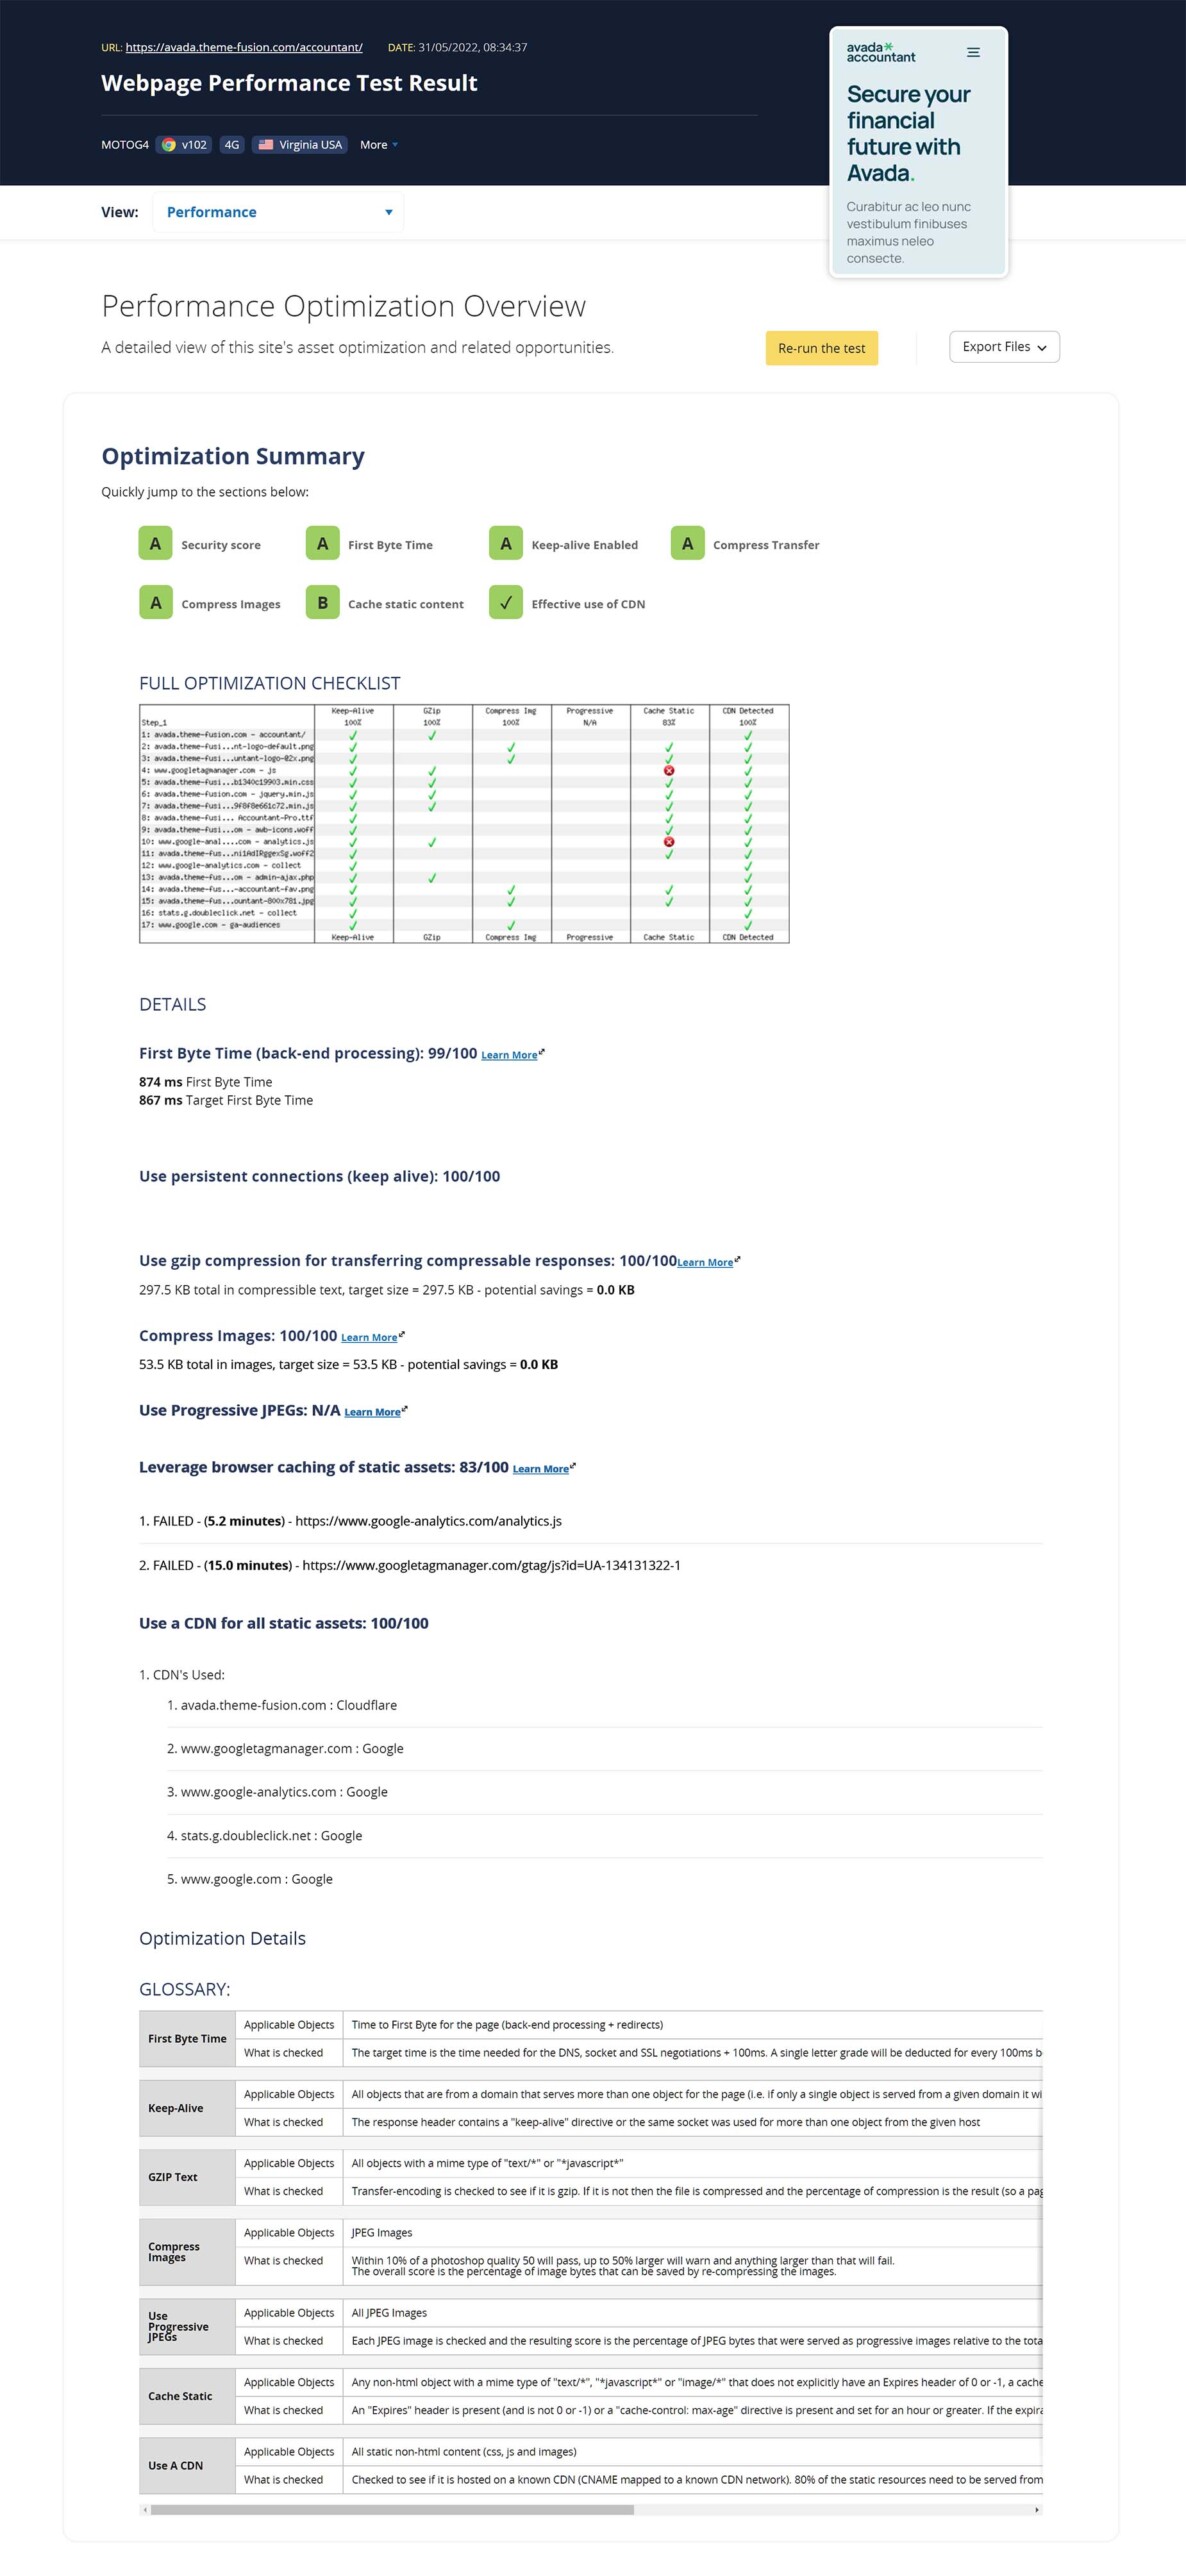
Optimisation
The Optimisation tab displays the old letter based score that WebPagetest used to show on thePerformance Summary. Here, the most important metrics are given an individual score, and you can click on a score to jump to the details further down the page.
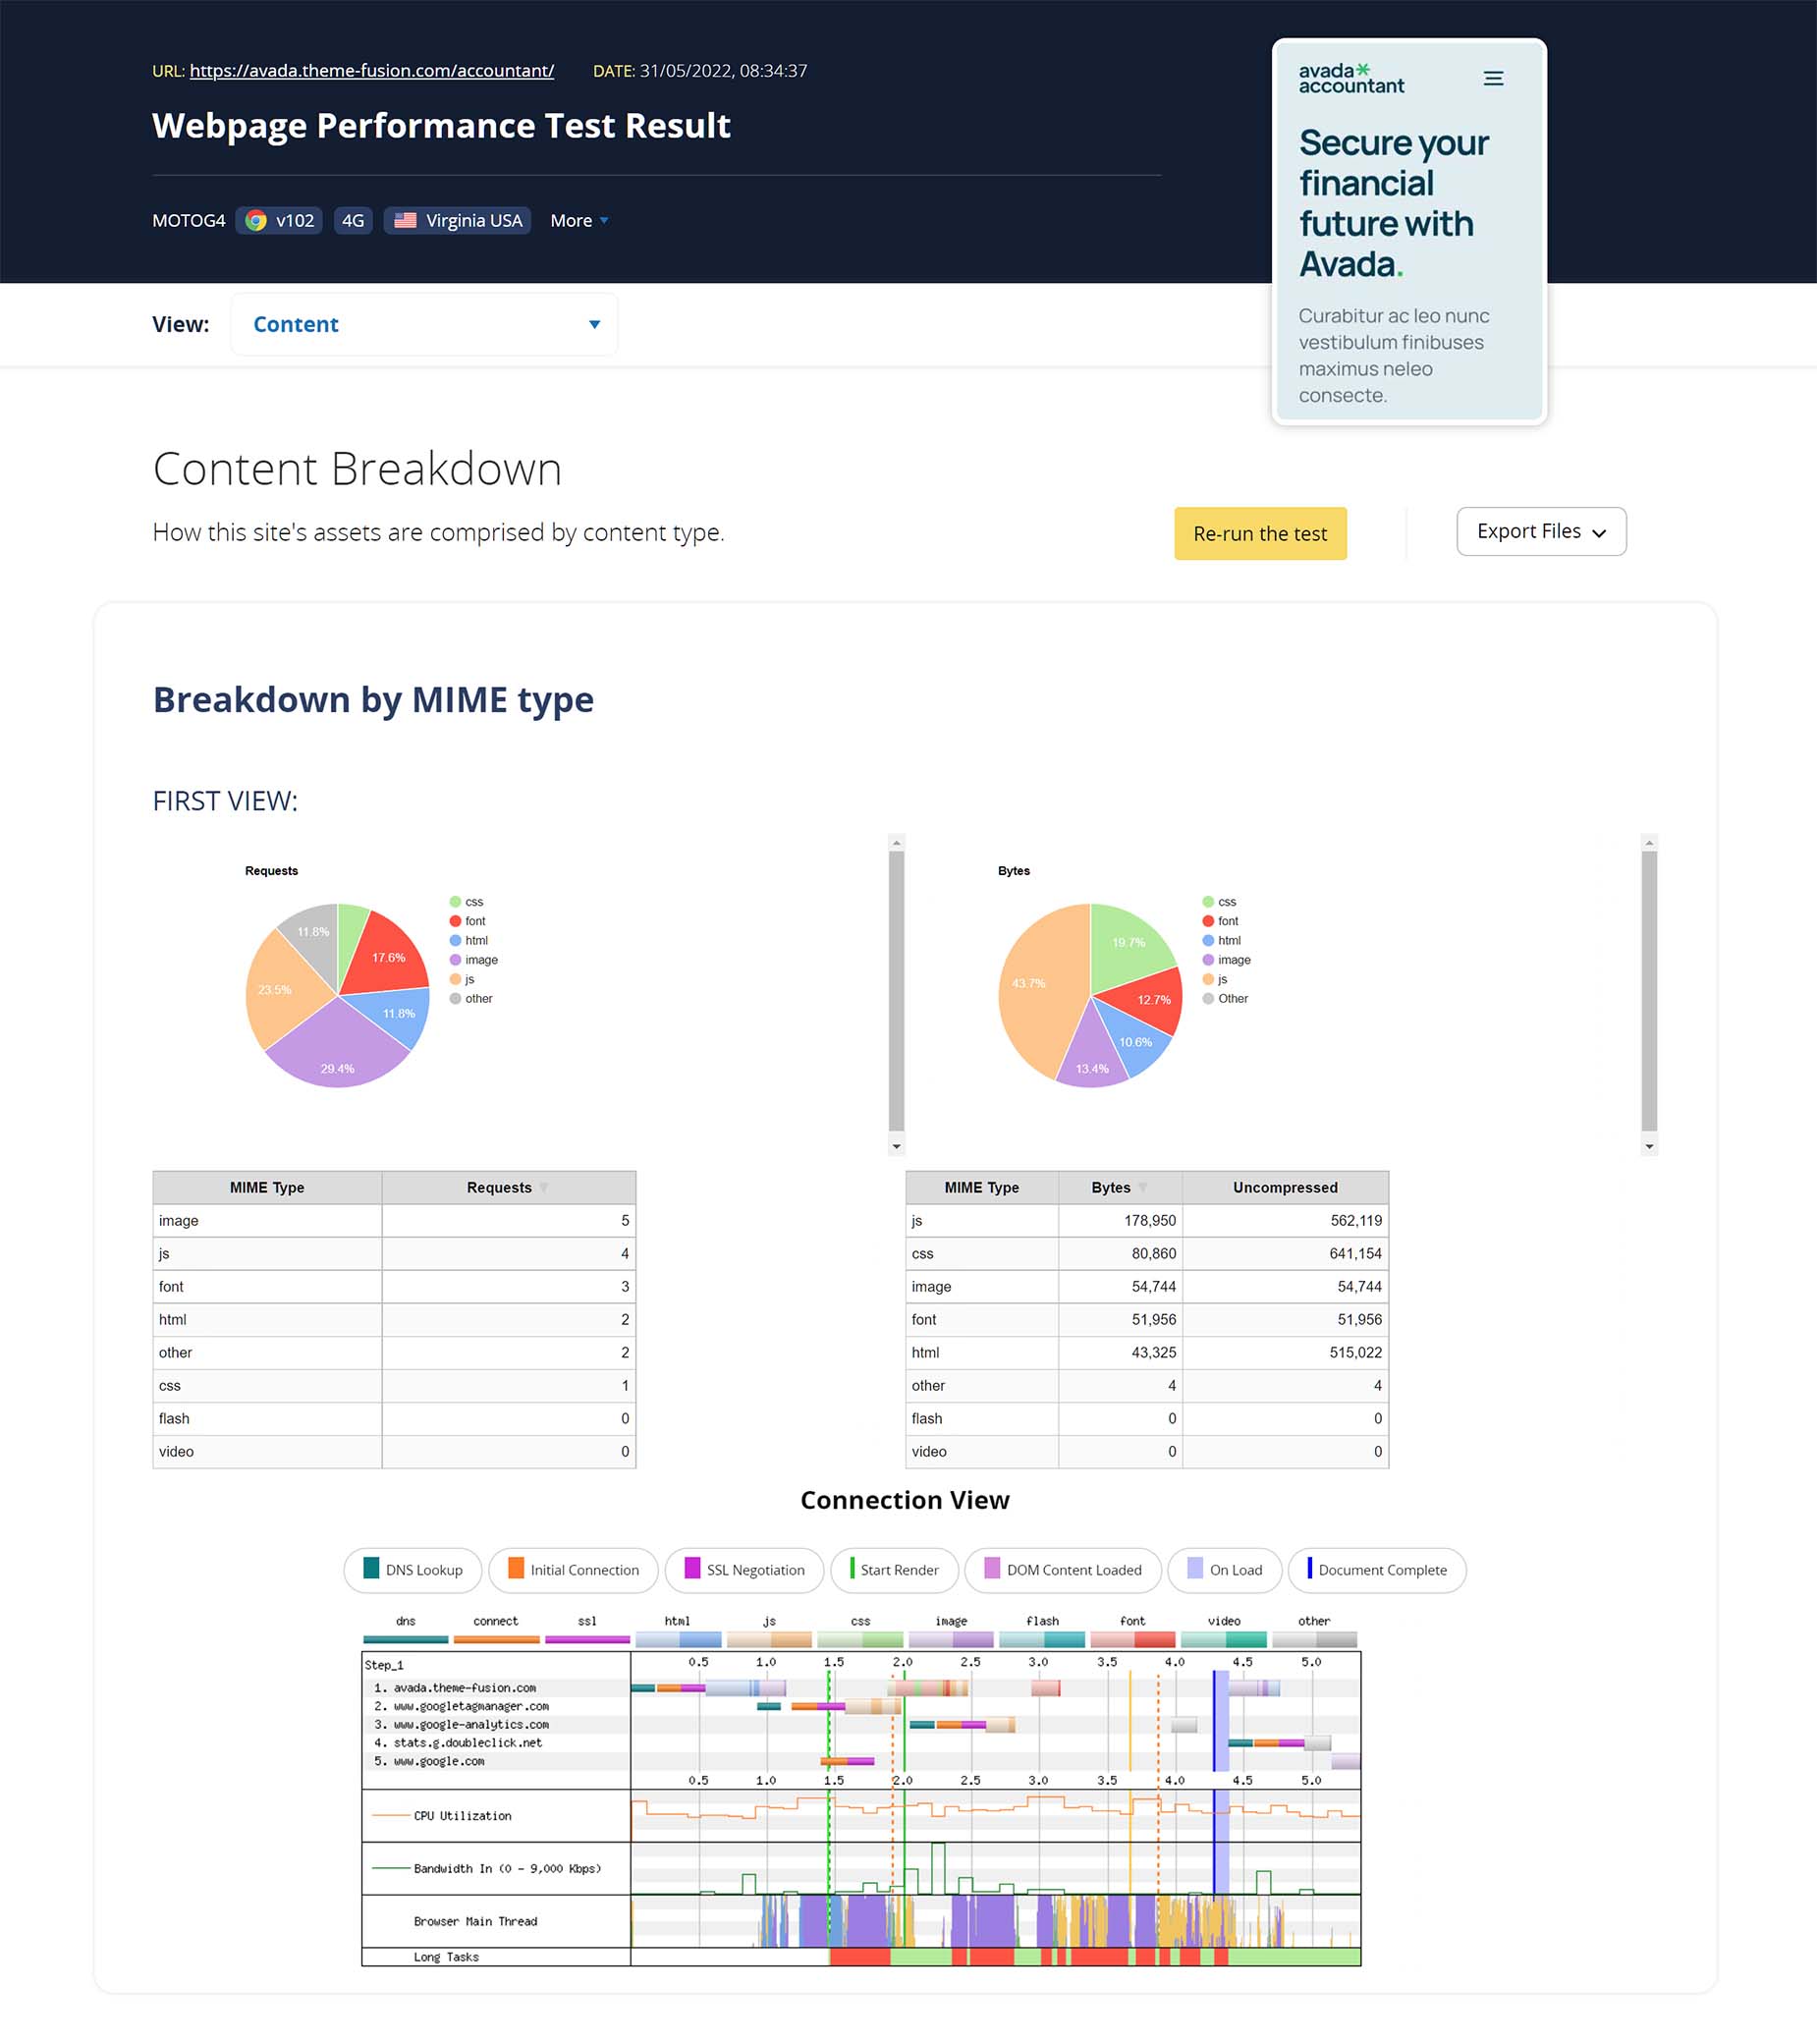
Content
The Content tab breaks down how this site’s assets are comprised by content type, and dispayed both in requests and bytes.
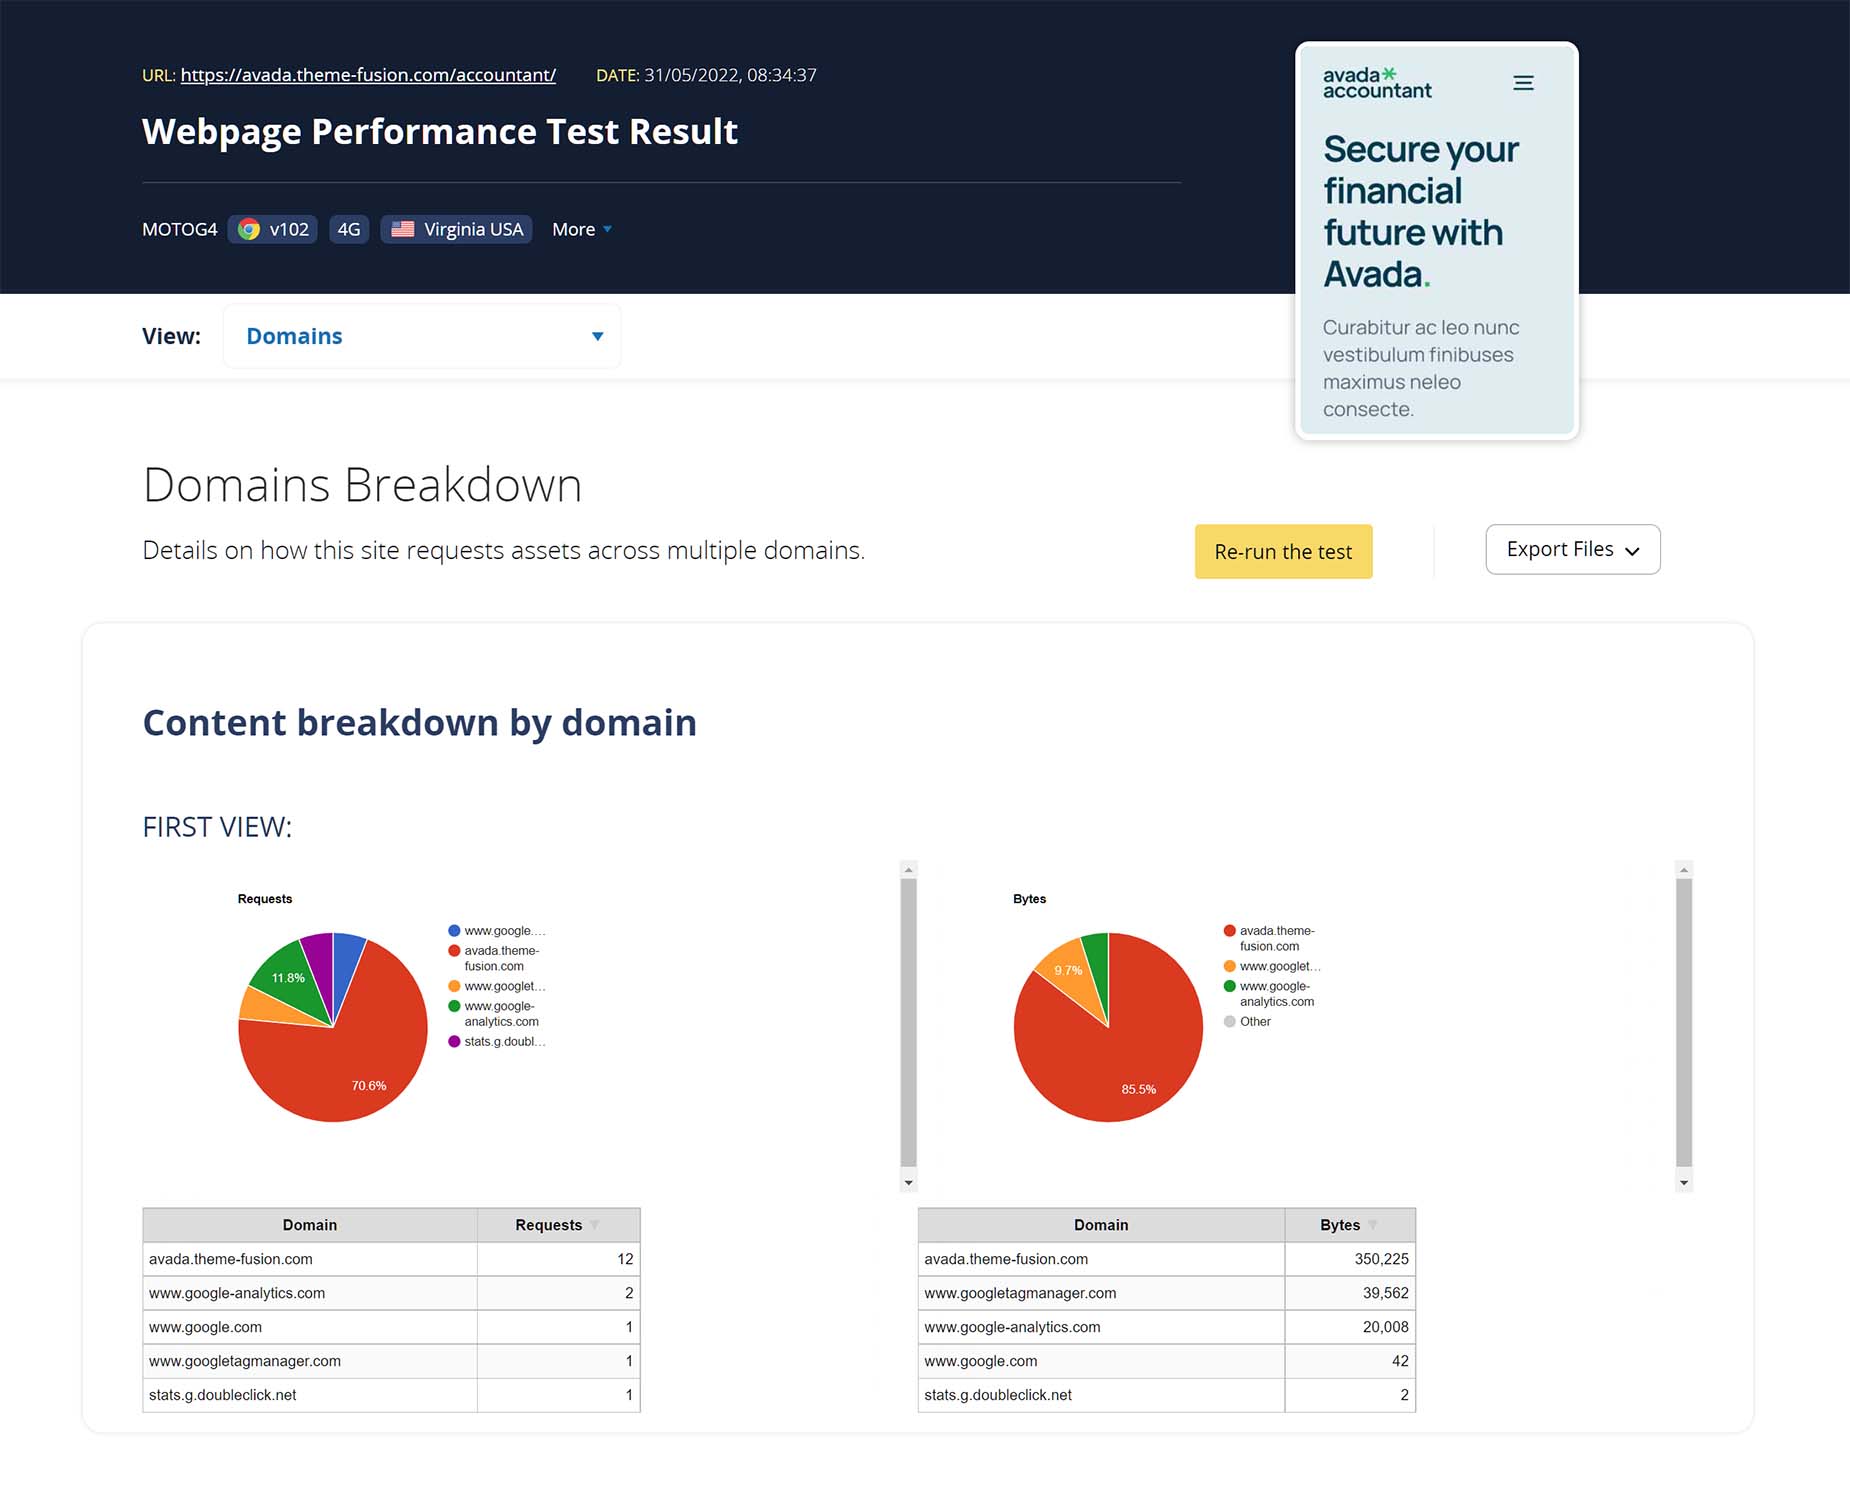
Domains
The Domains tab simply shows you content breakdown by domain. Depending on how your site is set up, this may only show one domain or several. Here, we can see a small percentage of requests and content is coming from Google Analytics and Google Tag Manager.
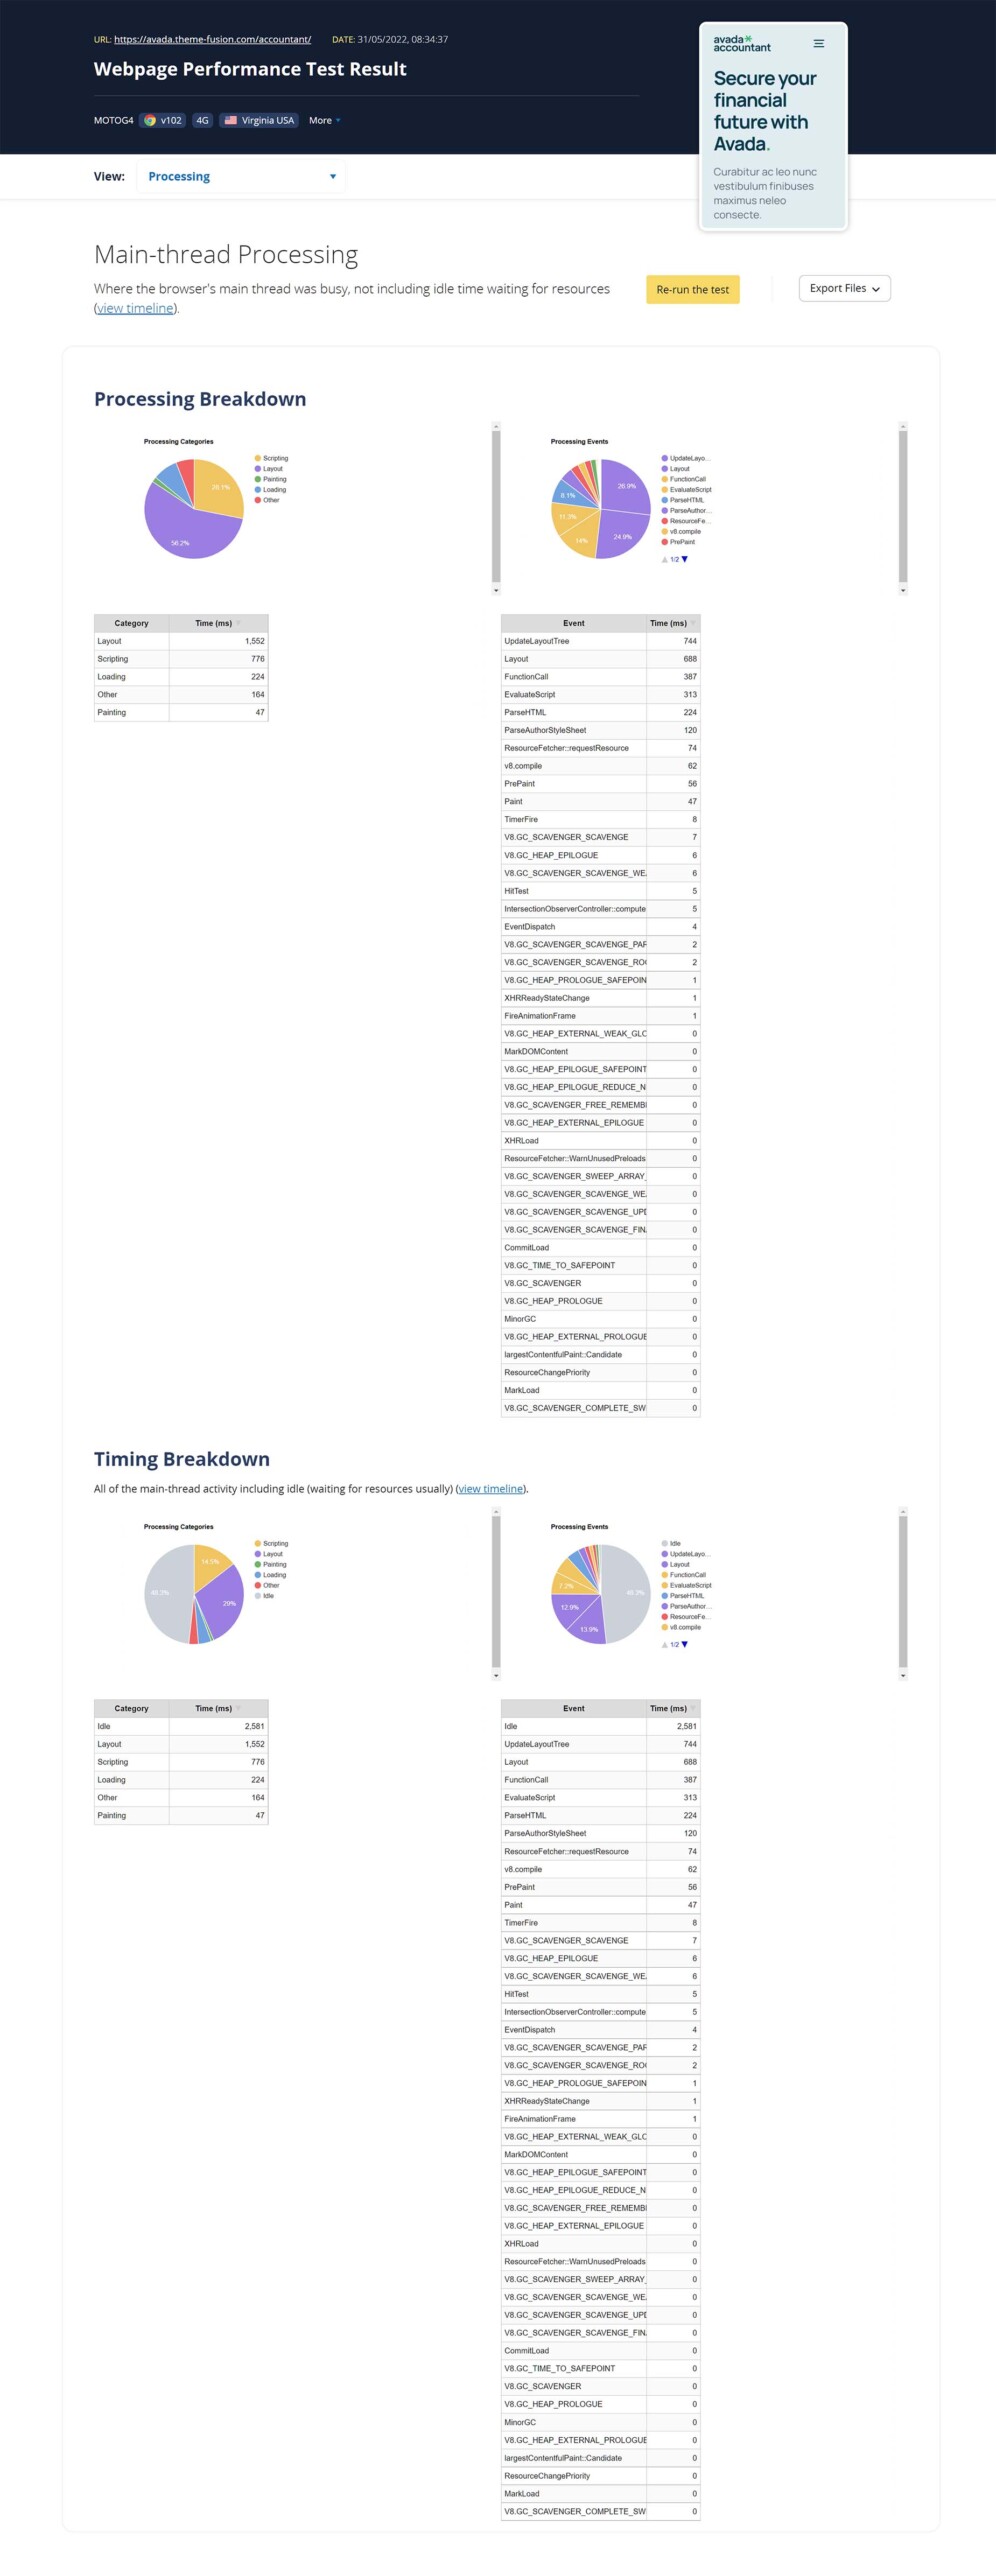
Processing
We are getting into seriously nerdy technical territory here, but the Processing Breakdown shows us the various Processing Categories and Processing Events and the percentages of each for the page load.
External Options
At the bottom of the Results menu are four external links for further analysis. These are Image Analysis, Request Map, Data Cost, and Security Score.
Conclusion
WebPageTest is a highly regarded testing platform, with a toolset mostly suited for developers, or advanced users. There are a profusion of testing locations, and this service gives you all the information you could ever need to optimize your website’s loading time.
Remember, due to hosting and content variables, website optimization is a very complex, technical area, and falls well outside of the support we can provide for Avada.
Apart from our many documentation resources, the Facebook Avada User’s Group has a large and very active membership, and this topic is regularly discussed on the Group.